
Why Is Dental Work So Expensive? About 69 cents of every dollar a dental office takes in goes to running the office, according to American Dental Association Health Policy Institute data for 2021 to 2025. That covers staff, lab bills, supplies, rent, equipment and insurance paperwork. The remaining 31 cents is the owner dentist’s pay before taxes and loan payments, so a dental fee is mostly a share of an expensive room, not a markup on a filling.
The sticker shock is real. A $1,200 crown estimate lands before anyone has explained a single line of it, the price isn’t posted anywhere, and the insurance card in your wallet may cover less than you assumed. This article follows the money inside a practice: payroll, lab invoices, sterilization, debt, and the way insurance sets the ceiling on what a plan pays. It stops short of procedure price lists, strategies for patients without coverage, and the differences in prices between regions and practice types.
Key Takeaways
- Practice expenses averaged about 69% of revenue per dentist in ADA data for 2021–25, up from about 66% in 2016–20. What is left is the dentist’s pre-tax income, not a profit margin for investors.
- Labor is the largest single cost. Hygienists earned a median $98,100 and dental assistants $48,070 in 2025 (BLS), and 87.7% of dentists recruiting hygienists in mid-2026 called it very or extremely challenging.
- Indebted dental graduates in the class of 2025 owed an average of $297,800 (ADEA). At 8.07% over ten years, that is a payment near $3,600 a month in a simple hypothetical.
- Payments haven’t kept pace. ADA panel data show reimbursement up 19% since January 2021 while general inflation rose 27%. About 65% of dental PPOs cap yearly benefits at $1,500 or more, though fewer than 5% of enrollees reached the cap between 2014 and 2023.
- Dental prices aren’t a runaway outlier. Dentists’ prices received rose 41.6% from June 2010 to December 2025, against 50.1% for consumer prices overall. The latest one-year reading is steeper: dental services CPI was up 5.0% in the year to August 2026.
- Dentists’ incomes aren’t the explanation. Inflation-adjusted net income for general dentists has declined for about 15 years, the ADA reports, to an average of $215,320 in 2025.
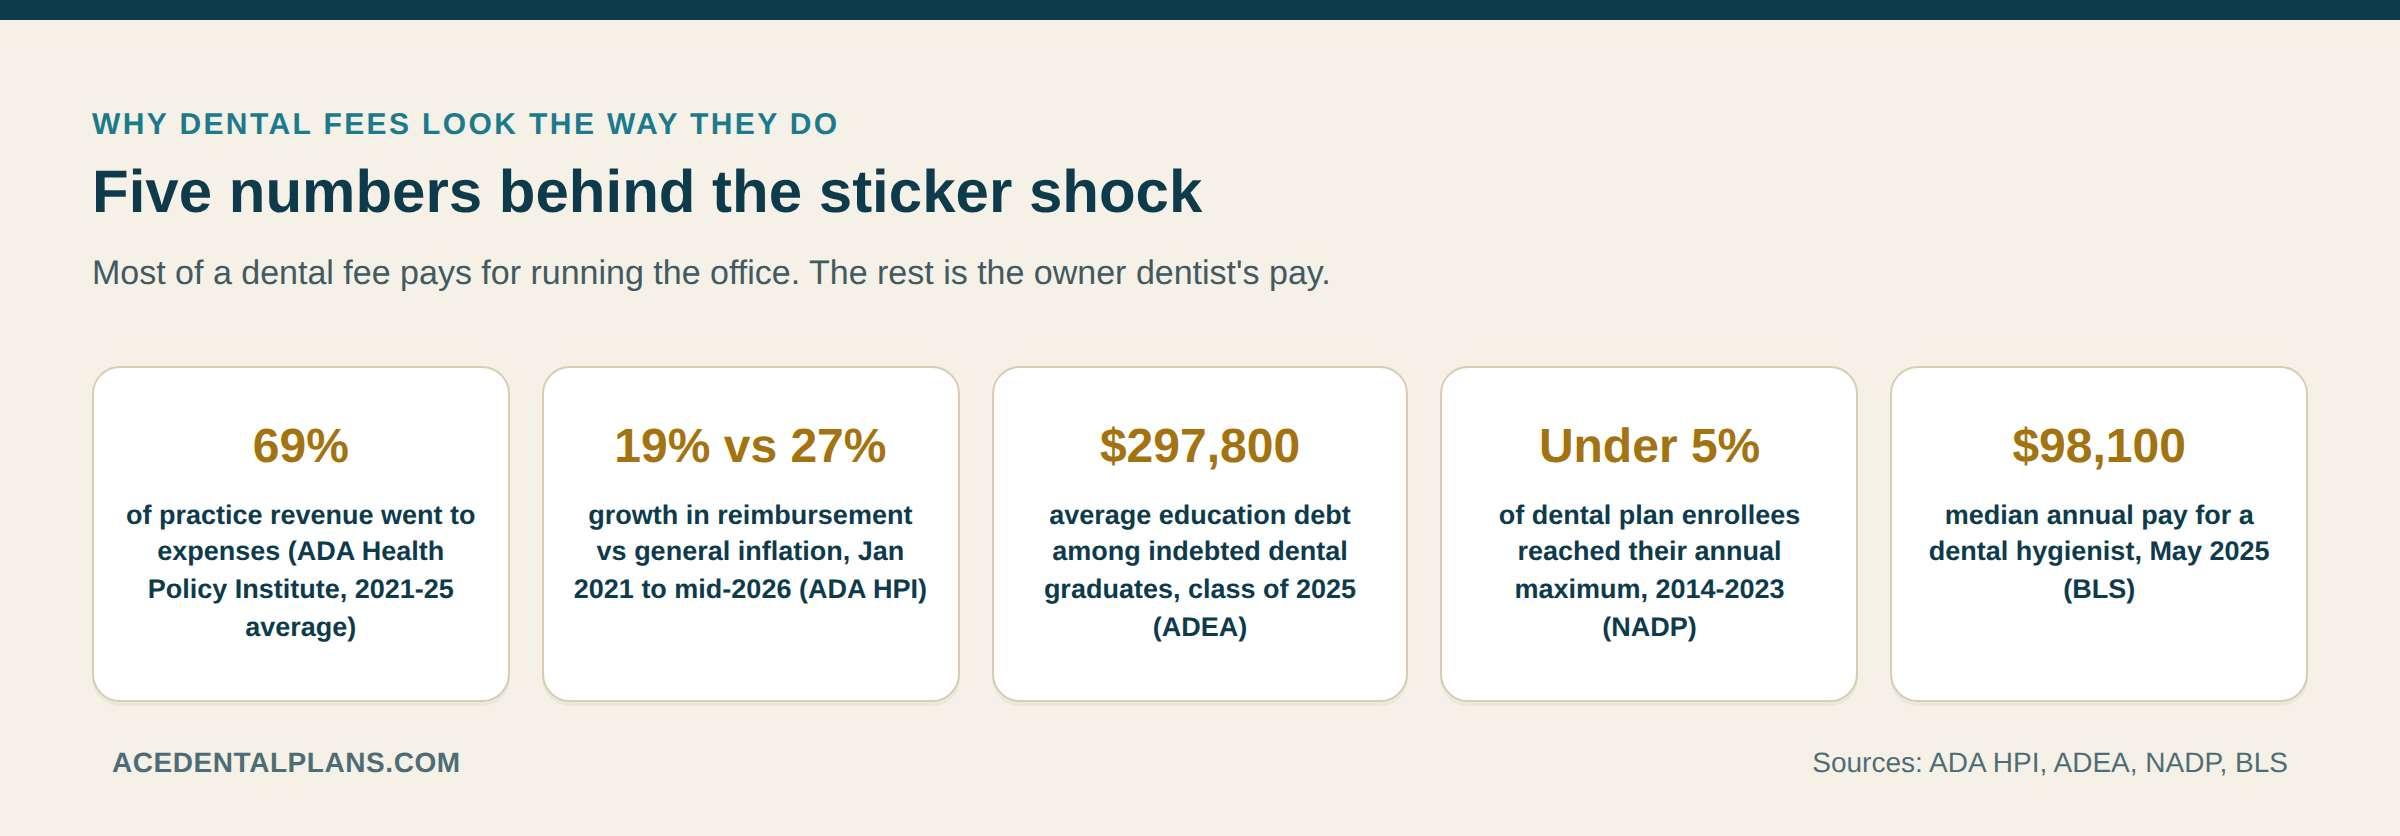 Five numbers from ADA, ADEA, NADP and BLS data that explain most of what sits behind a dental fee.
The ADA Numbers: What 69 Cents of Overhead Means
The most useful single figure comes from the ADA Health Policy Institute’s 2026 report on dentists’ income, revenue and hours worked. Pooling five years at a time, it puts average revenue per dentist at $804,144 for 2021–25 and average expenses at $552,909. Divide one by the other and expenses come to 68.8% of revenue. Why Is Dental Work So Expensive…
| Measure | 2016–20 | 2021–25 | Change |
|---|---|---|---|
| Revenue per dentist | $793,274 | $804,144 | +1.4% |
| Expenses per dentist | $527,028 | $552,909 | +4.9% |
| Net income per dentist | $266,400 | $244,729 | −8.1% |
| Expenses as a share of revenue (our calculation) | 66.4% | 68.8% | +2.4 points |
| Net income as a share of revenue (our calculation) | 33.6% | 30.4% | −3.2 points |
Read the table sideways. Over the two periods, revenue crept up 1.4% while expenses grew 4.9%, so the dentist’s income took the hit. Researchers at the ADA call this a fiscal squeeze. For a patient, the lesson is that a fee isn’t padded at the top; the cushion is thin because more of each dollar is spoken for before the owner is paid.
Two cautions on what “net income” means here. It is the owner’s take-home before income tax, and it has to cover the owner’s own loan payments, retirement savings and health insurance. It isn’t a corporate profit margin. Also, the published figures don’t sum to exactly 100% (68.8% plus 30.4% is 99.2%), so treat them as close approximations rather than an audited ledger.
Other published overhead numbers differ, which is worth knowing before you quote any of them. A 2015 analysis by the Levin Group, published in Dental Economics, put the median overhead of general practices at about 75% and suggested a target of about 59%. Different years, different samples, and different rules about what counts as overhead produce ratios from the high 50s to the mid 70s. The 69% figure is recent and comes from the profession’s own survey, which is why this article leans on it.
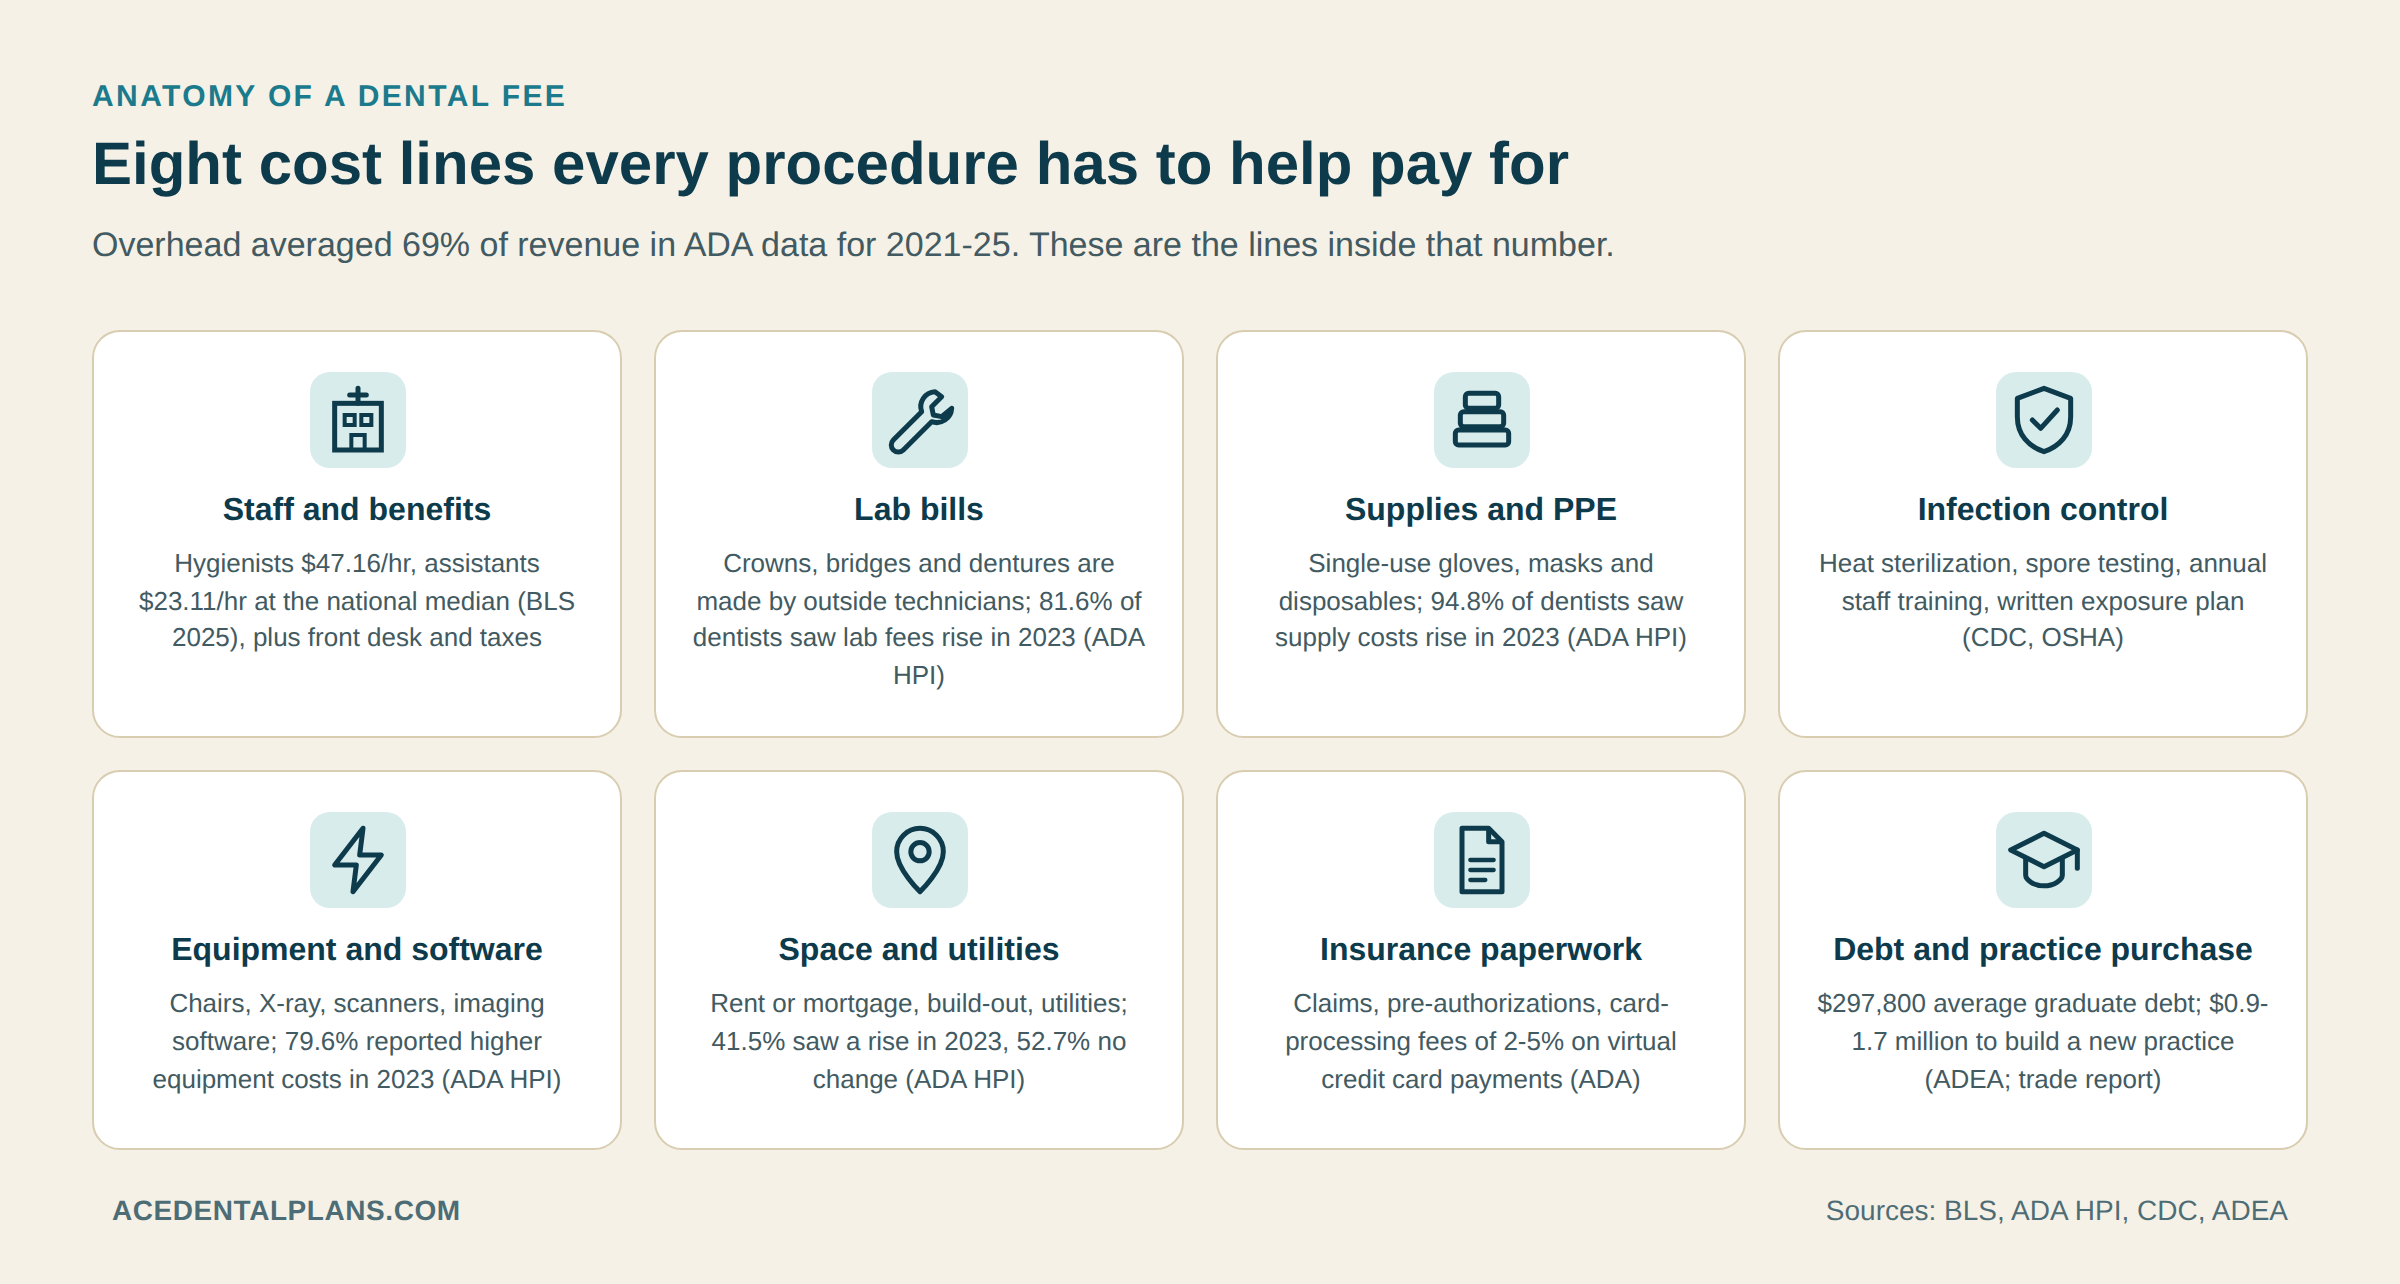 The eight cost lines that sit inside the roughly 69% overhead figure, with a sourced number for each.
Chair Time Is the Product: What One Hour of Dentist Time Must Cover
A dental office sells time in a chair. Everything else, from the building to the autoclave to the receptionist, exists to keep that chair productive and safe. So the cleanest way to see why a fee looks big is to convert the ADA averages into an hour.
ADA data for 2025 show dentists working 36.1 office hours a week on average. Of those, 30.5 go to treating patients and 5.1 to non-clinical duties such as managing staff and paperwork. The 5.1 hours earn nothing directly, yet they keep the practice running. Spread across a year, they sit inside the price of the hours that do earn revenue.
The arithmetic has a flaw worth admitting. Revenue per dentist includes work billed for hygienists and others in the same office, so the per-hour figure overstates what the dentist’s own hands generate. Even so, it shows the scale. About $394 of every clinical hour is already spent before the dentist takes a dollar, which is why short appointments rarely come with small fees.
Idle time costs money too. In the ADA’s fourth-quarter 2025 panel, 33% of dentists said they weren’t busy enough, up from 25% a year earlier. The lease, the payroll and the loan payments don’t shrink when a morning is half empty. Meanwhile, in mid-2026, 28% of dentists said they were too busy to treat everyone who wanted care, and new patients waited about 13.9 days for an appointment. Both ends of that spectrum put pressure on fees: a quiet office has to earn its fixed costs from fewer visits, and a full one has less reason to discount.
Labor: Who Is on the Payroll and What the Work Costs
Staffing is the biggest piece of overhead, and the Bureau of Labor Statistics supplies the pay data. In May 2025 the median hygienist earned $98,100 a year ($47.16 an hour), the median dental assistant $48,070 ($23.11 an hour), and the median dentist $176,110. The BLS counted 225,300 hygienist jobs, 388,600 assistant jobs and 161,400 dentist jobs.
Those job counts imply a staffing pattern. Nationally there are about 1.4 hygienists and 2.4 assistants for every dentist. Some of those workers sit in schools, hospitals and clinics rather than private offices, so treat the ratio as a rough guide.
Hiring is hard, which pushes wages up. In the ADA’s second-quarter 2026 survey, 36.8% of dentists were recruiting hygienists and 87.7% of those called it very or extremely challenging. For assistants, 38.2% were recruiting and 68.2% found it very or extremely challenging. Hygienists need an associate degree that typically takes three years, and all states license them, so the supply can’t grow quickly.
Dental staff wages rose 23% from January 2021 through mid-2026 in the ADA’s panel data, a bit slower than the 27% rise in general inflation over the same stretch. An earlier ADA survey from August 2023 found that 89.4% of dentists had seen staff wages rise over the previous year. Wage growth that roughly tracks everyone else’s isn’t a scandal, but a practice can’t push back against it by working faster. A hygienist cleans one mouth at a time.
A good share of staff work never appears on an invoice. Someone verifies benefits, files claims, chases denied ones, sets up pre-authorizations and answers the phone when a patient asks why the estimate changed. That time is paid for out of the same pool as the clinical work.

Equipment, Technology and Infection Control: Costs Patients Never See
Most of what a dental office buys is invisible from the waiting room. There’s the chair, the delivery unit, the suction, the compressor, the X-ray equipment and the software that stores the images. There’s also the sterilization room, which in many offices is as busy as the treatment rooms.
Infection control is a legal and clinical requirement, not a luxury. The CDC’s dental infection-control guidelines call for single-use gloves discarded after each patient, protective eyewear, masks and protective clothing, and instrument reprocessing with monitoring of sterilizers through spore testing. The CDC’s summary of dental infection prevention lists failure to heat-sterilize handpieces between patients as a documented breakdown. Staff exposed to blood or other potentially infectious material must receive training on assignment and at least annually. Under OSHA’s bloodborne pathogens rules, employers must also offer hepatitis B vaccination and keep a written exposure-control plan.
Each of those requirements consumes supplies and hours. A handpiece that must be sterilized between patients means either buying more handpieces or waiting for a sterilizer cycle. Disposable barriers, gloves and masks are bought by the case. Staff time spent breaking down and setting up a room is time not spent treating anyone.
Equipment costs have moved with everything else. Equipment and supply prices were up 23% since January 2021 in the ADA’s second-quarter 2026 panel, and its fourth-quarter 2025 report put them up 5% in a single year. In an earlier ADA survey, 79.6% of dentists reported higher equipment costs over the prior year and 94.8% reported higher supply costs. About one in four dentists told the ADA in late 2025 that they planned a major equipment purchase.
This article doesn’t put dollar figures on specific machines, such as scanners or 3D X-ray units. Published prices vary by vendor, configuration and service contract, and the ones that are easy to find come mostly from sellers. What matters for your bill is the structure: a large upfront purchase, then software licenses, repair contracts and training, spread over the number of patients the machine serves.
| Cost line | What is in it | What pushes it up | Evidence in the sources |
|---|---|---|---|
| Staff and benefits | Hygienists, assistants, front desk, billing, associates, payroll taxes, benefits | Hiring difficulty, licensing requirements, wage competition | BLS 2025 medians: hygienist $98,100, assistant $48,070; ADA: staff wages up 23% since Jan 2021 |
| Dental lab fees | Crowns, bridges, dentures, night guards, implant parts made by outside technicians | Skilled labor, materials, shipping, remakes when a fit fails | 81.6% of dentists reported higher lab fees in the 2023 ADA survey |
| Supplies and PPE | Gloves, masks, filling materials, anesthetic, impression and bonding materials | Single-use rules, supplier pricing, volume | 94.8% reported higher supply costs; 74.8% reported higher PPE costs (2023 ADA survey) |
| Infection control | Sterilizers, spore testing, instrument pouches, water-line care, training | CDC and OSHA requirements, instrument sets per patient | CDC guidelines: single-use gloves, PPE, sterilizer monitoring, annual staff training |
| Equipment and imaging | Chairs, X-ray, scanners, handpieces, compressors, repairs | Capital cost, replacement cycles, service contracts | 79.6% reported higher equipment costs (2023); equipment and supplies up 23% since 2021 (ADA) |
| Software and records | Practice management, imaging storage, patient messaging, cybersecurity | Subscription pricing, data-protection duties | No national figure in the sources used here |
| Space and utilities | Rent or mortgage, build-out, utilities, cleaning | Local property markets, lease terms | 41.5% reported higher rent or mortgage costs in 2023; 52.7% reported no change |
| Insurance administration | Claims, appeals, pre-authorizations, payment-processing fees | Number of payers and plan rules | ADA: card-processing fees often 2% to 5% per virtual credit card payment; $15 per paper-check fee in one example contract |
A word on the row you won’t find: professional liability coverage, state licensing and continuing-education fees, and compliance work. Every practice carries them, but the sources used here give no national dollar figure. They are small beside payroll, yet they exist whether a dentist sees ten patients or twenty, which makes them another fixed cost the fee has to absorb.
Space is the cost line that follows geography most closely, though the evidence is thinner than people assume. In the ADA’s 2021–25 data, rural dentists averaged higher revenue per dentist ($913,633) than urban dentists ($790,100). Rural revenue grew 11.9% from the previous five-year period while urban revenue was flat (down 0.1%). No explanation for the gap accompanies the figures. Rent, wages and the number of competing offices could each play a part, but that’s speculation, not a finding. What the figures do show is that a national average hides offices with quite different economics. In the ADA’s 2023 survey, 52.7% of dentists reported no change in rent or mortgage costs, while 41.5% reported an increase.
Dental Labs and Materials: Why a Crown Arrives With a Third-Party Invoice
Many restorations aren’t made in the dental office at all. A crown, bridge or denture is often fabricated by a dental laboratory from a scan or impression, then returned for fitting. The lab bills the practice, and the practice builds that bill into the fee.
The people doing that work are skilled but not highly paid. The BLS put median pay for dental and ophthalmic laboratory technicians at $47,060 in 2025, with dental laboratory technicians at $49,610, and counted 34,400 dental technician jobs. A high school diploma is the typical entry requirement. Lab labor therefore isn’t an obvious source of inflated fees, though the cost of ceramics, metals and milling equipment is passed along.
Automation is changing this line. The BLS projects that employment of dental laboratory technicians will decline 6% through 2035, citing automation and 3D printing. In-office milling units let some practices make a crown on the spot, which removes the lab invoice but replaces it with a machine purchase and software. Whether that lowers the patient’s fee depends on how many crowns the practice makes and how the owner prices them, so it isn’t automatic.
Materials follow no single trend. In the ADA’s 2023 survey, 9.2% of dentists reported lab fees up more than 20% over the prior year. Another 25.1% reported rises of 11% to 20%, and 47.3% reported rises of 1% to 10%. A further 17.9% saw no change. That spread explains why two nearby offices can quote different prices for the same crown without either one being careless.
Where a $1,200 Crown Fee Might Go
Why Is Dental Work So Expensive? Here is the cost structure in one picture. The $1,200 figure is hypothetical, a round number chosen to keep the arithmetic readable. What is sourced is the top-level split: the ADA’s 2021–25 data imply that about 69% of revenue goes to expenses and about 31% remains as the dentist’s pre-tax income. The splits inside overhead are assumptions, set so the arithmetic is visible.
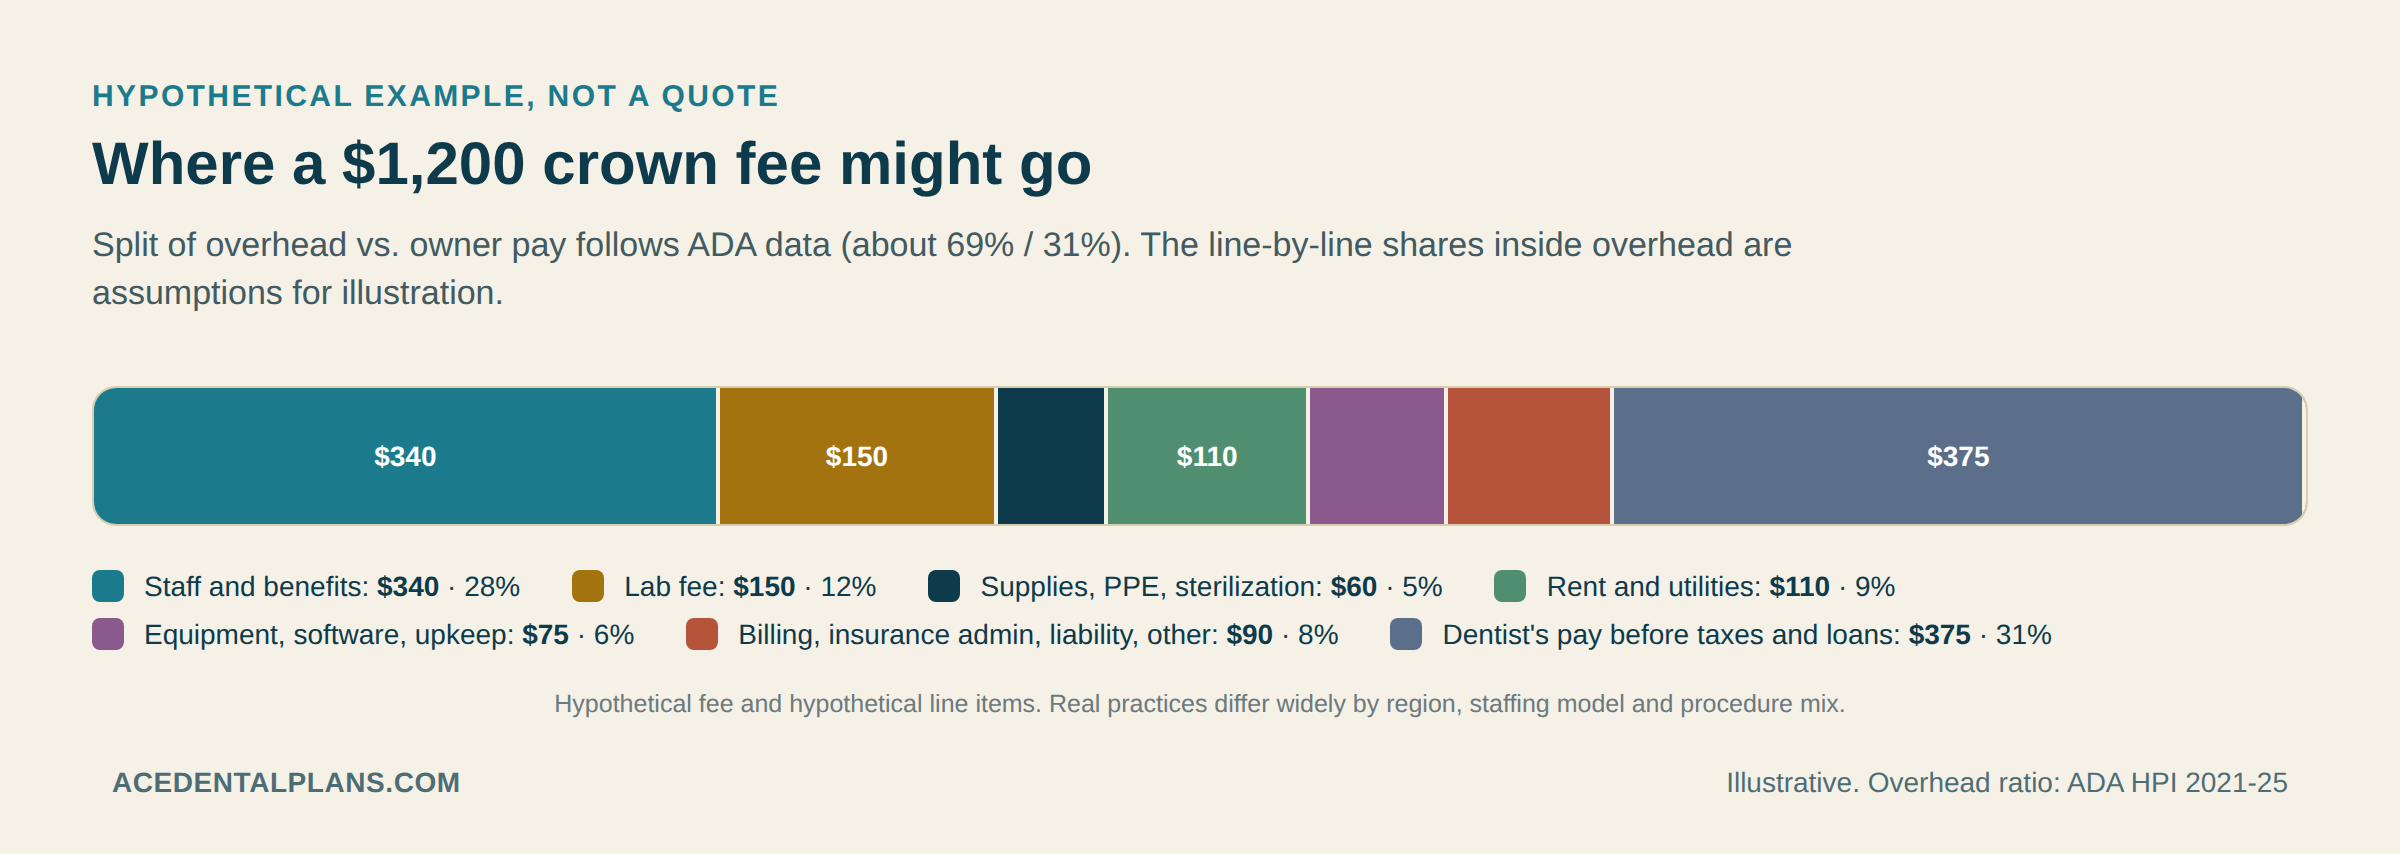 A hypothetical $1,200 crown fee split into overhead lines and dentist pay. Only the overall 69% / 31% split rests on ADA data.
Two things stand out. First, the dentist’s share looks large at $375 until you recall what it covers: a skilled professional’s two hours, the owner’s loan payments and the risk of running a small business. Second, even if the dentist took nothing, the fee would still have to be about $825 to keep the doors open. The cost structure leaves little room to absorb a patient who wants a lower price.
Why a ten percent discount is roughly a one-third pay cut
Most practice costs don’t fall when a price does. The lease, the payroll, the loan on the equipment and the sterilizer are the same whether the fee is $1,200 or $1,080. That is the reason a modest discount costs an owner far more than it seems to.
The same arithmetic runs in reverse when costs rise. A 4.9% increase in expenses against a 1.4% increase in revenue, the ADA’s five-year comparison, took a visible bite out of dentists’ income. Practices respond in three ways: raise fees, see more patients, or cut what they pay out. Raising fees is the response that patients notice.
It also explains why offices are cautious about across-the-board discounts and why network contracts matter so much. A contract that pays 25% below the list fee isn’t a small adjustment to the office’s income; it can decide whether the chair is worth filling at that price. Some offices therefore leave the network, as the ADA’s survey data suggest many have.
Eight Years of School and a Loan Payment: Education Debt and Practice Purchase
A dentist’s training is long and expensive, and the debt is part of the cost structure whether or not it appears in the fee conversation. Most states require a Doctor of Dental Surgery or Doctor of Dental Medicine degree from an accredited program plus passing licensing exams. Dental school typically takes four years after a bachelor’s degree, according to the BLS. Every specialty then adds a residency of two to four years, or four to six for oral and maxillofacial surgery.
| Item | Figure | Source and year |
|---|---|---|
| Average first-year cost, public school, in-state | $46,845 | ADA Health Policy Institute, 2025–26 |
| Average first-year cost, public school, non-resident | $79,168 | ADA Health Policy Institute, 2025–26 |
| Average first-year cost, private school, resident | $90,090 | ADA Health Policy Institute, 2025–26 |
| Average education debt among indebted graduates | $297,800 (class of 2025); $312,700 (class of 2024) | ADEA (class of 2025); Oral Health Group citing ADEA (class of 2024) |
| Share of graduates leaving school with no debt | 18% | ADA Health Policy Institute, 2026 |
| New annual federal cap on professional-degree loans | $50,000 per year, from July 1, 2026 | ADA Health Policy Institute |
| Dentists who own a private practice | 72.5% in 2023, down from 84.7% in 2005 | ADA Health Policy Institute |
| Recent graduates (2016–2020) who own a practice | 21% | Becker’s Dental Review, citing ADA data, 2026 |
| Estimated cost to build a new competitive practice | $900,000 to $1.7 million | Practice-sales broker report, via Becker’s Dental Review, August 2026 |
The tuition numbers are first-year costs, so they understate the four-year total. Costs run from about $35,000 a year at the least expensive public school to above $150,000 a year at the high end, per the ADA. The federal government capped professional-degree borrowing at $50,000 a year starting July 2026. Students whose costs exceed that will lean on private loans, which the ADA says carry rates of 3% to 18%.
Debt shapes how dentists work. By 2023, 72.5% of dentists were private practice owners, down from 84.7% in 2005, per the ADA. Becker’s Dental Review, citing ADA data, put ownership among 2016–2020 graduates at 21%. The same report cites a practice-sales broker’s estimate of $900,000 to $1.7 million to build a new competitive practice from scratch. Fewer owners and more employees means more dentists work in group or corporate settings, which the next section returns to.
Student debt isn’t a line item on a patient’s invoice. It shows up indirectly. A new dentist needs to earn enough per hour to service the loan, an owner may not be able to afford a lower fee, and a practice’s purchase price becomes something the new owner must collect.
How Insurance Shapes the Fee: Allowed Amounts, Write-Offs and a Cap That Barely Moves
Insurance enters the cost story from two directions. It determines what a practice collects from insured patients, and it sets the ceiling on what a plan will pay in a year. Follow a claim in the usual order: plan type, then deductible and network, then coinsurance, then the annual maximum.
The plan type decides who sets the price. In a dental PPO, the plan contracts with dentists for a discount from their usual fees. The National Association of Dental Plans (NADP) calls the negotiated rates “contracted fees.” The plan’s allowed amount is the most it will recognize for a service. If a dentist is out of network, the plan may base the allowed amount on what it deems the usual, customary and reasonable charge for the area. The dentist may then bill the patient for the difference, which is called balance billing.
That write-off is why a list fee and a collected fee diverge. The practice books $900 on that claim, and a practice whose expenses run near 69% of revenue has to cover them from contracted amounts on every insured patient. The list fee still matters for patients who are uninsured or out of network, and as the starting point for negotiating contracts, so many offices hold it above the contracted rates. Whether that is reasonable or merely convenient is a fair question, and the sources used here don’t settle it.
Reimbursement has lagged costs. In the ADA’s second-quarter 2026 panel, reimbursement from all payers rose 19% from January 2021 through mid-2026, against 27% general inflation, 23% for staff wages and 23% for equipment and supplies. The panel’s index for private insurance stood at 121 and for public insurance at 118, with January 2021 as 100. Put differently, payers’ rates grew at roughly 70% of the pace of inflation.
Contracts add friction. An example contract in the ADA’s contract-issues guidance for dentists includes a “most favored nations” clause. It requires the dentist’s charge for covered services to be no higher than the lowest rate charged to other patients. The guidance also describes payment methods that cut the net. Virtual credit card payments can carry processing fees of 2% to 5% per transaction, and one example contract deducts $15 per paper check. In the ADA’s view, small per-transaction fees can erode practice revenue across thousands of claims.
Many dentists have responded by leaving networks. In the fourth quarter of 2025, 35.0% of dentists told the ADA they planned to drop at least one insurance network in 2026, and 29.3% had done so during 2025. When an office drops a plan, patients with that plan pay the office’s list fee, minus whatever the plan allows an out-of-network benefit to cover. That can look to a patient like a price increase, even though the fee didn’t change.
The annual maximum: a ceiling few members reach
The annual maximum is the most a dental plan pays toward your care in a plan year. The NADP reports that about 65% of dental PPOs have a maximum of $1,500 or more. From 2014 through 2023, fewer than 5% of enrollees on average reached it. Individual PPO premiums averaged $41.76 a month and employer-provided employee-only premiums $28.70 to $30.71 a month in the NADP’s figures, about one-twentieth of medical premiums per person.
No source reviewed for this article documents when annual maximums were last raised, so it doesn’t claim a date. What the numbers allow is a purchasing-power check. Using the consumer price index, a hypothetical $1,500 maximum set in January 2000 would need to be about $2,960 today to buy the same amount. A hypothetical $1,000 maximum from January 1990 would need to be about $2,620. Those are our calculations from CPI values of 169.3 (January 2000), 127.5 (January 1990) and 334.131 (August 2026), not claims about any plan’s history.
The point isn’t that insurers are villains. A plan priced to cost a patient $30 a month can’t also absorb most of a large bill. The point is narrower. A maximum in the low thousands sits far below what major restorative work costs, so the patient is weighing a procedure against a benefit that was never built to cover it.
Why Dental Coverage Works Differently From Medical Coverage
People often expect a dental bill to behave like a medical one. It doesn’t, and the difference explains a lot of the surprise at the front desk. Medical plans are built around protection from rare, very large costs. Dental plans are built more like prepaid maintenance, with a low limit and a low premium.
| Feature | Typical medical plan | Typical dental plan | Effect on what you pay |
|---|---|---|---|
| Premium level | Roughly 20 times a dental premium per person (NADP) | About $41.76 a month for an individual PPO; $28.70–$30.71 for employer employee-only PPO (NADP) | A low premium funds a small benefit pool |
| Yearly limit | Out-of-pocket maximum: up to $12,000 for an individual in plan year 2027 (HealthCare.gov); the plan pays covered in-network costs after that | Annual maximum: about 65% of PPOs at $1,500 or more (NADP); you pay everything above it | Medical limits what you pay; dental limits what the plan pays |
| Cost sharing | Deductible, coinsurance and copays within the out-of-pocket cap | Deductible usually $50–$100; preventive often 100%, basic often 80% in network (60% out), major often 50% (NADP) | The costliest services carry the highest share for the patient |
| Routine care in public programs | Original Medicare covers physician and hospital care | Original Medicare excludes routine dental care such as cleanings, fillings and extractions (CMS) | Many older adults pay the full fee unless they have other coverage |
| Marketplace status | Medical coverage is the core of a Marketplace plan | Dental is an essential health benefit for children only; stand-alone plans may impose waiting periods (HealthCare.gov) | Adults can buy coverage and still wait before it applies |
 A medical plan caps what you pay; a dental plan caps what it pays; Original Medicare pays nothing toward routine dental care.
The consequence for pricing is subtle. When a large share of patients carry little or no meaningful coverage, the dentist can’t rely on insurance to absorb a fee in the four figures. The patient does, and patients push back. That can push some offices toward lower fees and others toward payment plans, and some patients toward skipping care. Dental spending reached $189 billion in 2024, about 3.6% of total health spending, per the ADA Health Policy Institute.
Why Cleanings Cost Less Than Crowns
The cost structure explains the price ladder inside a single office. A cleaning is mostly hygienist time, uses few materials, needs no outside lab and is the service many plans pay for in full. A crown needs a dentist, an assistant, an anesthetic, impression or scan work, a temporary, a lab fabrication and a second visit.
Plan design adds another layer. Preventive services are often covered at 100% and basic ones at 80%, per the NADP, while major services typically get 50%. A patient who sees a $0 cleaning bill and, say, a $600 crown bill concludes that the crown is inflated, when part of the gap is how the plan splits the cost. The plan’s design makes preventive visits look free and shifts the felt cost to restorative work, which is also where the lab, the materials and the extra time live.
Clinical fees also reflect risk and skill. A tooth restored with a crown must fit, bear a bite for years and stay clean. If the lab-made crown doesn’t fit, the practice redoes it and pays for the remake. That’s one reason practices price restorative work above hygiene even when the chair hour is the same.
How Fees Get Set, and Why You Can’t Look Them Up
Each practice sets its own fees. There’s no national price list, and there can’t easily be one. By its own account, the ADA can’t quote fees for dental procedures and is forbidden by federal law to set or recommend fees. It discontinued its Survey of Dental Fees in 2023, after legal changes removed the safe-harbor protections that had covered such fee disclosures, according to the ADA Health Policy Institute.
That leaves a patchwork. Offices commonly build a fee from their own costs, local competition and what major plans in their market pay, then publish it to no one in particular. Insurers hold their own contracted rates; dentists hold the fee schedules; patients see a single number on an estimate. Consumer tools such as the FAIR Health consumer dental cost lookup, which the NADP points readers toward, estimate typical charges by area, and they are only estimates.
Patients who are uninsured or don’t use insurance have one federal lever. The CMS consumer page on understanding costs in advance says providers must usually give a good faith estimate if you ask for one or schedule care at least three business days ahead. It adds that you may be able to dispute a bill that is at least $400 more than the estimate. The page doesn’t single out dentists, so ask the office how it handles written estimates. The most useful thing the estimate can contain is the procedure code and the fee for each line, which makes comparison possible.
Opacity matters for a second reason. When patients can’t compare prices, there is less price competition to hold fees down, and offices compete on location, hours and reputation instead. That’s general market reasoning, not a finding from the sources used here.
Prices Over Time: Faster Than Inflation or Not?
The answer depends on the window. Over fifteen years, dentists’ prices have risen more slowly than the cost of living. Over the last twelve months, they have risen faster.
For the long view, use the BLS producer price index for offices of dentists (primary services). It stood at 100.0 in June 2010 and 141.6 in December 2025, a rise of 41.6%. Over the same stretch, consumer prices for all items rose 50.1% and medical care services rose 56.5%. All three series are BLS data republished by the Federal Reserve Bank of St. Louis. A producer index measures what establishments receive, so it reflects insurer payments as well as patient payments, and it’s consistent with the ADA’s account of stagnant reimbursement.
 Dental offices’ costs rose close to inflation since 2021, while what they were paid rose less; over fifteen years, dentists’ prices received lagged consumer prices.
The short view is different. In the BLS consumer price index release for August 2026, dental services prices were up 5.0% over twelve months. All items rose 3.4%, medical care services 2.5%, physicians’ services 2.0% and hospital services 5.2%. Dental services carry a relative importance of 0.922 in the index, meaning they make up under one percent of the typical urban consumer’s spending basket. In that same month, the index for dental services fell 0.6%, a reminder that a single reading says little.
Spending data add a sideways look. The ADA Health Policy Institute estimates that dental spending grew about 4% after inflation in 2024, slightly slower than the 4.6% growth in health spending overall. Within that, private insurance spending rose 2.3%, out-of-pocket spending 3.3% and government program spending 9%. Out-of-pocket spending grew faster than private insurance spending, which is consistent with plan benefits buying less, though the ADA’s summary doesn’t draw that conclusion.
Put the two readings together and you get a plausible story rather than a proven one. After years of fees lagging costs, many practices may be raising list fees faster to catch up. That reading comes from joining the ADA’s squeeze data to the CPI jump and isn’t a finding from either source. The ADA’s own framing is that expenses are growing faster than reimbursement, which hasn’t kept pace with inflation or practice costs.
What Could Lower the Cost Structure, and What Each Option Trades Away
If the bill is a function of the cost of delivering care, then the realistic ways to lower prices are the ways that lower those costs. Several models exist. None is free, and none works for every treatment.
Teledentistry
The ADA defines teledentistry as the use of telehealth systems in dentistry when patient and dentist are in different places. Its guidance separates live, two-way visits (code D9995) from store-and-forward reviews of images, scans and photos (code D9996). Both codes are reported in addition to other procedures and apply to claims filed with dental plans, not medical plans. Teledentistry can save a trip for a triage question or a follow-up review. A filling, a crown prep or an extraction still needs hands in the mouth, so the savings are limited to the front end of care.
Group practices and dental support organizations
The ADA Health Policy Institute reported that 16% of dentists were affiliated with a dental support organization in 2024. It describes affiliation with large groups as growing, especially among early-career dentists. In principle, shared purchasing, billing and management can spread fixed costs across many offices. The sources used here don’t show whether that reaches patients as lower fees. They do show a difference in behavior. In late 2025, 38.7% of DSO-affiliated dentists planned to drop an insurance network in 2026, against 29.0% of other dentists. And 54.8% of DSO dentists planned to add staff, against 41.7%. A larger group may also be less flexible about one patient’s request for a different treatment plan or payment arrangement.
Public and community options
The National Institute of Dental and Craniofacial Research lists several lower-cost routes. Dental schools and dental hygiene schools offer treatment by students under close supervision by licensed dentists. Federally funded community health centers charge on sliding fee scales based on income, and they operate in most cities and many rural areas. Medicaid and CHIP cover child dental services, and adult coverage varies by state. These models lower the price by changing who does the work, who owns the building and who pays the bill, not by finding a cheaper way to run a standard practice.
The trade-offs are practical. School clinics may involve longer visits because students work under supervision, and many have screening steps before treatment. Community health centers may have waiting lists and income limits. Medicaid participation among dentists is a separate problem: the ADA reports that while Medicaid dental benefits have expanded in most states, dentist participation and use among beneficiaries have stayed flat.
Technology that substitutes for labor
The BLS expects dental laboratory technician employment to fall 6% through 2035 because of automation and 3D printing. In-office milling and printing move some lab work in-house. Whether that lowers a patient’s fee depends on volume and pricing choices. A machine has to be paid off whether it makes ten crowns a year or a thousand.
Common Explanations Compared With the Evidence
Some explanations for dental prices circulate widely. A few have support, some have partial support, and one or two don’t fit the data. The table sorts them using the sources in this article.
| Explanation | What the evidence shows | Assessment |
|---|---|---|
| Dentists’ incomes keep climbing | ADA: average net income for general dentists was $215,320 in 2025; inflation-adjusted income has declined for about 15 years; net income per dentist fell 8.1% between 2016–20 and 2021–25 | Not supported |
| High-tech equipment is the main reason | Equipment and supplies rose 23% since January 2021 and 79.6% of dentists reported higher equipment costs in 2023, but a staffing sketch at national medians comes to about 31% of revenue before benefits | Real, but secondary to labor |
| Dental labs inflate the bill | Lab technicians’ median pay was $47,060 in 2025; 81.6% of dentists reported higher lab fees; no source here measures markup on lab work | Partly true; markup unmeasured |
| Insurance is the reason fees are high | Reimbursement rose 19% since 2021 against 27% inflation; contracts set allowed amounts below list fees; administrative costs add up | Mixed: insurance shapes list fees, but the lag is in payments |
| Prices are rising far faster than everything else | Dentists’ prices received rose 41.6% from June 2010 to December 2025 against 50.1% for all items; but dental services CPI rose 5.0% in the year to August 2026 | Depends on the window |
| Corporate ownership drives prices up | 16% of dentists were DSO-affiliated in 2024; the sources used here don’t compare fees by ownership type | Unproven here |
Two myths deserve a direct reply. The first is that dental care is expensive because dentists are earning ever-larger incomes. Data from the ADA point the other way. Even the BLS figure of $176,110 median pay for dentists is a pre-tax number, and most owners repay education and practice debt out of it. The second is that costs are padded by invisible charges. Much of what looks invisible is real cost, such as sterilization, claim handling and training, though that’s a statement about categories rather than about every individual fee.
That doesn’t mean every fee is fair. Two offices with similar costs can charge different amounts, and an estimate that seems out of line is a reason to ask questions. The cost structure explains why the baseline is high. It doesn’t excuse a particular quote.
What a patient can do with this
This article is about the supply side, so the practical advice is short. Ask for an itemized written estimate with a procedure code and fee for each line. If you have a plan, ask the office for the plan’s allowed amount rather than the list fee, along with how much of your annual maximum the treatment would use. Ask whether the treatment can be done in phases across plan years. Ask what it would cost if some of it were done at a dental school or a community health center.
One more use for the numbers in this article is as a sanity check, not a verdict. If an estimate for a single crown is far below the roughly $1,100 to $1,200 range implied by two chair-hours at national average revenue, ask what is included and whether any steps are billed separately. If it’s far above, ask the same question. A gap isn’t proof of anything. It’s a prompt to ask which lines of the estimate belong to the lab, the extra visit, the materials or the plan’s contract, and to compare two or three written estimates for the same procedure code.
Before treatment, check what your plan counts as basic versus major, whether the office is in network, and any waiting periods. Treatment decisions belong to you and your dentist; the point of the questions is to see the numbers before you decide, not to challenge the clinical recommendation.

Frequently Asked Questions – Why Is Dental Work So Expensive
How much of what I pay goes into the dentist’s pocket?
On average, about 31 cents of each revenue dollar remained as the dentist’s pre-tax income in the ADA’s 2021–25 data, and the rest paid expenses. That 31 cents also has to cover income taxes, retirement savings and any education or practice loans. Individual offices vary widely.
Why does a crown cost so much more than a filling?
A crown typically involves more dentist time, more materials, usually two visits and often an outside lab fee. A filling is usually one visit with fewer steps. Plan design adds to the gap because major services are often covered at a lower percentage than basic ones.
Do dentists mark up lab work?
None of the sources used here measures markup on lab work, so no one can give you a reliable percentage from this evidence. What the data show is that 81.6% of dentists reported higher lab fees in the ADA’s 2023 survey. The fee you’re quoted usually includes the lab’s invoice plus the dentist’s time to prepare, place and adjust the restoration.
Why did my dentist leave my insurance network?
Often because contracted rates haven’t kept up with costs. Some 35.0% of dentists told the ADA they planned to drop at least one network in 2026, and reimbursement from all payers rose 19% since January 2021 against 27% inflation. If your dentist is out of network, ask for the plan’s out-of-network benefit and the office’s fee before you book.
Does a dentist’s student debt show up in what I pay?
Indirectly. In the earlier hypothetical, a payment of about $43,500 a year divided across about 1,403 clinical hours is roughly $31 per hour, or about $62 on a two-hour crown. That’s an illustration with assumed loan terms, not a line on your bill, and it applies only to dentists who carry that much debt.
Why hasn’t the annual maximum gone up?
No source used here gives a single reason. Fewer than 5% of enrollees reached the maximum from 2014 through 2023, and plans are priced against expected claims, so raising the cap would change the premium that everyone pays. Whether plans should raise it is a policy argument, and the NADP and the ADA frame it differently.
Are corporate dental chains more expensive?
The sources in this article don’t compare fees by ownership type, so there’s no evidence here either way. About 16% of dentists were affiliated with a dental support organization in 2024, and group practices differ widely in how they price and which plans they accept. Compare the written estimates from a few offices.
What does the average dentist earn?
The ADA reports average net income of $215,320 for general practitioner dentists in 2025, and the BLS reports median pay of $176,110 for dentists in May 2025. The two measures differ in who is counted, so they don’t conflict. Owners often earn more than associates, but they also carry the practice’s debts and risks.
Will dental prices come down?
Nothing in the sources forecasts a decline. Costs for staff, supplies and equipment have risen since 2021, and hygienist and assistant recruiting remains hard. Automation and 3D printing could lower lab and production costs over time, but whether the savings reach patients depends on pricing decisions that no source predicts.
Is a dental school clinic or health center cheaper than a private office?
Dental school clinics and community health centers can cost less because students are supervised and fees may be set on a sliding scale, according to the NIDCR. They can also involve longer visits and eligibility limits. Compare the written fee, the visit count and the travel time.
Sources and Disclaimers – Why Is Dental Work So Expensive
Figures about practice finances come from the ADA Health Policy Institute’s 2026 income report and its quarterly dental economy panels (second quarter 2026 and fourth quarter 2025). The 2023 cost-increase percentages come from an ADA survey as reported by Becker’s Dental Review. Wage and employment data are BLS May 2025 figures. Price-index values come from the BLS consumer price index release for August 2026 and from BLS series republished by the Federal Reserve Bank of St. Louis. Education debt comes from ADEA and the ADA, and plan-design figures come from the NADP, CMS and HealthCare.gov. The $1,200 crown breakdown, the hourly revenue calculation, the staffing sketch, the loan payment, the claim example and the annual-maximum purchasing-power figures are hypothetical calculations built from those sources. They are not quotes. The line-by-line shares inside overhead are assumptions. National averages hide wide variation by region, specialty and practice model. Confirm every price with your dentist and every benefit with your insurer before you commit to treatment.
- American Dental Association Health Policy Institute: Trends in Dentists’ Income, Revenue and Hours Worked (2026)
- American Dental Association Health Policy Institute: State of the U.S. Dental Economy, Q2 2026
- American Dental Association Health Policy Institute: State of the U.S. Dental Economy, Q4 2025
- American Dental Association Health Policy Institute: Dental Practice Research (ownership and DSO affiliation)
- American Dental Association Health Policy Institute: Dental Education (tuition and enrollment)
- American Dental Association Health Policy Institute: Federal Loan Caps on Dental Education
- American Dental Association Health Policy Institute: The Dental Care Market (fee survey status)
- American Dental Association Health Policy Institute: National Dental Expenditures, 2024
- American Dental Association: Dental Insurance Contract Issues
- American Dental Association: Guide to Understanding and Documenting Teledentistry Events (D9995 and D9996)
- ADA News: Dental Fiscal Squeeze Continues Into 2026
- American Dental Education Association: Educational Debt
- Bureau of Labor Statistics: Occupational Outlook Handbook, Dentists
- Bureau of Labor Statistics: Occupational Outlook Handbook, Dental Hygienists
- Bureau of Labor Statistics: Occupational Outlook Handbook, Dental Assistants
- Bureau of Labor Statistics: Occupational Outlook Handbook, Dental and Ophthalmic Laboratory Technicians
- Bureau of Labor Statistics: Consumer Price Index News Release (August 2026)
- Federal Reserve Bank of St. Louis (BLS data): Producer Price Index, Offices of Dentists: Primary Services
- Federal Reserve Bank of St. Louis (BLS data): Consumer Price Index for All Urban Consumers: All Items
- Federal Reserve Bank of St. Louis (BLS data): Consumer Price Index: Medical Care Services
- National Association of Dental Plans: Understanding Dental Benefits
- National Association of Dental Plans: Glossary of Dental Insurance Terms
- Centers for Medicare & Medicaid Services: Medicare Dental Coverage
- Centers for Medicare & Medicaid Services: Understanding Costs in Advance (Good Faith Estimates)
- HealthCare.gov: Out-of-Pocket Maximum/Limit
- HealthCare.gov: Dental Coverage in the Health Insurance Marketplace
- National Institute of Dental and Craniofacial Research: Finding Dental Care
- Centers for Disease Control and Prevention: Guidelines for Infection Control in Dental Health-Care Settings, 2003
- Centers for Disease Control and Prevention: Summary of Infection Prevention Practices in Dental Settings
- Becker’s Dental Review: How Costs Are Increasing at Dental Practices (ADA survey, 2023)
- Becker’s Dental Review: Why the Next Generation of Dentists Isn’t Buying Practices
- Oral Health Group: Dental Schools Weigh Shorter Training Pathways as Student Debt Mounts
- Dental Economics: How Does Your Overhead Compare to National Averages? (2015)
Important Information and Disclaimers
This article is general educational information. By using it, you accept the limits described below.
Not dental or medical advice
Nothing on this page is a diagnosis, a treatment recommendation or a substitute for an examination by a licensed dentist or physician. Reading this article does not create a dentist-patient or doctor-patient relationship. Only a licensed professional who has examined you and reviewed your history can tell you what your mouth needs. Do not delay, skip or stop professional care because of something you read here.
Prices are estimates, not quotes
Cost figures are ranges reported by the third-party sources cited in this article. Actual prices depend on your location, the provider, the complexity of your case, the materials used, the date of service and other factors, so what you pay may be higher or lower. A written treatment plan and fee estimate from the dental office is the only reliable number for your situation.
Insurance and plan examples are illustrations
Examples that use named amounts or percentages are hypothetical. Real benefits depend on your plan, network, waiting periods, annual maximum, deductible and the insurer’s rules at the time of treatment. A pre-treatment estimate or benefits check is not a promise of payment. Confirm the details with your insurer or plan administrator in writing.
Not insurance, legal, tax or financial advice
AceDentalPlans is an information publisher. Nothing here is insurance, legal, tax, investment or other professional financial advice, and nothing here recommends a particular provider, insurer, lender, discount plan or financing product. Company and product names belong to their owners and appear for identification only. Read the terms of any loan, financing offer or plan before you sign, and ask a qualified professional if you need advice on your own circumstances.
Third-party sources
This article cites government agencies, professional associations, insurers, lenders and other outside organizations. We do not control those sources. Their content can change, move or disappear, and listing a source is not an endorsement of it or of anything it sells.
No warranty
We aim for accuracy, but this article is provided “as is,” without warranties of any kind, express or implied, including warranties of accuracy, completeness, timeliness or fitness for a particular purpose. Some information may be out of date or contain errors by the time you read it.
Limitation of responsibility
To the fullest extent permitted by law, AceDentalPlans and its owners, authors and contributors are not responsible or liable for any loss, cost, injury, health outcome or other damage that results from using this article or relying on it. You are responsible for your own decisions about your care, your coverage and your money.
How this article is written
This article follows AceDentalPlans’ answer-first, U.S.-focused editorial approach. It uses conditional language for insurance, because coverage depends on the specific plan, and it names its sources so that you can read them yourself.