
Americans spent roughly $189 billion on dental care in 2024, and yet the average adult still pays around $310 of that out of pocket every year, more if they’re uninsured or living below the poverty line.† That gap between total national spending and what an individual patient owes is really the whole story of dental costs in the U.S.
Care is expensive in aggregate, and coverage is uneven. The size of your own bill depends heavily on where you live, whether you have dental insurance at all, and which of roughly a dozen very different categories of treatment you actually need. This guide steps back from any single procedure’s price tag to look at the bigger picture. It covers what the country spends, who’s covered and who isn’t, what actually moves a bill up or down, and the realistic ways to bring your own cost down when a dentist’s estimate is more than you expected.
Key Takeaways
- National dental spending reached about $189 billion in 2024, funded mostly by out-of-pocket payments and private insurance, which together cover roughly 80% of the total.
- About 87% of Americans have some form of dental benefit; the remaining 13%, roughly 40 million people, have none.
- Cost, not fear or inconvenience, is the top reason people skip dental care they know they need. Around 15% of the population went without needed care in a recent multi-year study.
- Where a procedure falls on the preventive-to-major spectrum matters more to your wallet than almost any other single factor, since insurance coverage drops sharply as treatment gets more complex.
- Geography, practice type, materials and whether you’re in-network all shift the same procedure’s price meaningfully, sometimes by hundreds of dollars.
- Discount plans, FSA/HSA funds, dental schools, community health centers and payment financing are all realistic ways to lower a bill, each with a different trade-off.
 Five numbers that frame what dental care actually costs the country, and the people in it.
What Dental Spending Looks Like Across the Country
Start with the national number, because it puts everything else in context. Dental services spending hit approximately $189 billion in 2024, up about 6.6% from the year before, according to CMS’s National Health Expenditure data. That’s a little over 4% of everything the U.S. spends on health care in a given year. Dental spending grew a bit slower than hospital care or physician services that same year, but it’s still climbing faster than general inflation. That’s part of why a filling or a crown can feel more expensive than it did five years ago, even after accounting for typical price increases.
Two payment sources do almost all of the work. Out-of-pocket spending rose 5.8% in 2024, and private insurance spending rose 4.8%; combined, they funded about 80% of every dollar spent on dental care that year. Government programs, mostly Medicaid and Medicare Advantage, made up most of the rest, and that category grew fastest of all, up 9%. Compare that to medical care generally, where public programs, employer insurance and out-of-pocket spending are all closer to comparable shares. Dental starts to look like a different kind of market: one still leaning heavily on direct patient payment, in a way that hospital or physician care mostly moved away from decades ago.
None of this tells you what your own crown or cleaning will cost. It does explain something important about the shape of American dental care. It behaves more like a retail service industry, with prices set independently by each practice, than like the rest of medicine, where large payers negotiate most of the price on a patient’s behalf. That distinction is worth keeping in mind for everything that follows.
It also helps to translate that $189 billion figure into something closer to a household’s actual experience. Spread across roughly 330 million people, national dental spending works out to a little over $550 per person per year on average, though almost nobody actually spends that amount in any given year. Most people spend far less in a year with only routine cleanings, and a much smaller group spends far more in a year that includes a crown, a root canal or an implant. Averages like this describe the system, not any one person’s bill. That’s exactly why the category-by-category breakdown later in this guide tends to be more useful for planning your own budget than a single national number.

Why the Same Procedure Costs Different Amounts for Different People
Ask five people what a filling cost them and you’ll likely get five different numbers, and not because any of them is wrong. A handful of structural factors, not just “your dentist” or “your insurance,” combine to produce the final figure on any given bill.
Start with a distinction that trips up a lot of patients comparing notes with friends. The price a practice lists, sometimes called its list price or usual fee, is rarely the number a paying patient actually owes. An insured, in-network patient pays based on a negotiated allowed amount that can run well below the list price. An uninsured patient sometimes pays the full list price, and sometimes qualifies for a cash discount the practice offers specifically because billing a self-pay patient is simpler and faster than billing an insurer. Two people describing “what my filling cost” may be describing two entirely different numbers for the identical procedure at the identical practice, depending on which of these categories they fall into.
Geography does a lot of the heavy lifting. Rent, staff wages and the local cost of living vary enormously by state and by metro area, and a dental practice’s overhead flows straight into its fee schedule. The same crown that runs $1,100 in a lower-cost market can reasonably cost $1,800 or more in a major coastal city, with nothing about the clinical work itself any different. As a general pattern, practices in large coastal metro areas, think San Francisco, New York or Boston, tend to sit at the higher end of national price ranges. Practices in smaller cities and much of the South and Midwest tend to sit closer to the lower end. That’s a broad regional tendency, not a rule, and plenty of exceptions exist inside any single state.
Who owns the practice matters more than most patients realize. Dental care in the U.S. is still delivered mostly by independent, dentist-owned practices. But dental support organizations, companies that provide business and administrative services to multiple dental offices under shared branding or ownership structures, have grown steadily as a share of the market. Fee schedules, technology investment, marketing spend and negotiated supply costs can all look different at a large group practice than at a single-dentist office. That structural difference shows up in what two practices a few miles apart charge for an identical procedure code.
Materials and technique add or subtract real dollars. A porcelain crown costs more to fabricate than a resin one. A same-day, in-office milled crown avoids a lab fee but requires expensive chairside equipment the practice has to recoup. Digital X-rays, 3D imaging and other diagnostic technology raise the cost of running a modern practice, which shows up somewhere in the fee schedule even when it isn’t billed as its own line item.
Complexity is not optional pricing, it’s clinical reality. An impacted tooth takes longer and requires more skill to remove than an already-erupted one. Deep decay near a nerve may turn a routine filling into something closer to a root canal candidate mid-appointment. None of this is a practice padding a bill. It’s the actual time and expertise a harder case requires, and it’s a major reason “how much does a filling cost” never has one clean answer.
Network status changes the number that actually applies to you. An in-network dentist has agreed to accept a negotiated, often lower, fee for patients on that specific plan. The same dentist may charge a different, typically higher, fee to an out-of-network or self-pay patient for the identical procedure. This is one of the most common reasons a friend’s “my dentist only charged me $X” doesn’t transfer to your own experience, even at a similar-quality practice nearby.
Who actually performs the procedure changes the fee too. A general dentist and a specialist, an endodontist for a root canal, an oral surgeon for a complex extraction, a periodontist for gum surgery, often charge differently for overlapping procedures, reflecting years of additional specialty training. A general dentist referring a hard case to a specialist isn’t padding your bill. A specialist’s fee schedule usually runs higher than a general practice’s for the same code, and that’s a normal, expected part of getting more specialized care.
Timing carries its own premium. A same-day emergency appointment, an after-hours visit or a weekend urgent case typically costs more than the identical procedure scheduled during normal business hours. Part of that reflects real added cost to the practice. Part of it reflects the fact that emergency treatment is rarely the simplest version of a procedure by the time a patient is in enough pain to seek same-day care.
 Seven structural reasons the identical procedure can cost noticeably different amounts.
Cost by Category of Care, Not Just by Procedure (Dental Costs)
Individual procedure prices matter when you’re staring at a specific treatment plan. For understanding dental costs as a whole, it’s more useful to zoom out one level, to the broad categories dental plans and dentists themselves use to organize care. Where a procedure falls on this spectrum predicts a lot: not just its price, but how much of that price insurance is likely to pick up.
| Category | Example procedures | Typical price band | How insurance usually treats it |
|---|---|---|---|
| Preventive | Exam, cleaning, routine X-rays, fluoride, sealants | $0 – $350 per visit | Often covered close to 100% |
| Basic restorative | Fillings, simple extractions, non-surgical deep cleaning | $140 – $600 per procedure | Often covered around 70–80% |
| Major/prosthodontic | Crowns, root canals, bridges, dentures, surgical extractions | $900 – $6,500 per procedure | Often covered around 50%, with waiting periods common |
| Implants | Surgical placement, abutment, implant crown | $2,100 – $6,000 per tooth, more for full-arch cases | Coverage is the least consistent of any category |
| Orthodontic | Braces, clear aligners | $3,000 – $8,000 per full treatment course | Often a separate lifetime maximum, not the annual one |
| Cosmetic | Veneers, professional whitening | $300 – $2,500, highly variable | Typically excluded as elective |
Look at that coverage column and a pattern jumps out. The categories that cost the least tend to be covered the most generously, and the categories that cost the most tend to be covered the least. That’s not a coincidence or an unfair design. Insurers price preventive care generously in part because catching problems early is cheaper than treating them once they’ve become major restorative or surgical cases. It does mean the sticker shock of major or implant-level work often lands harder than the price alone would suggest, because it arrives at exactly the moment your coverage is thinnest.
Two categories deserve a quick flag. Orthodontic treatment is frequently tracked against its own separate lifetime maximum rather than sharing the annual dental maximum, which changes how you should think about timing it alongside other major work. And implant coverage varies so much from plan to plan, some cover a meaningful share, some cover almost nothing, some cap payment at what a bridge would have cost instead. It’s worth treating implant coverage as its own conversation with your insurer, rather than assuming it follows the same pattern as a crown or a denture.
The practical use of this table is less about memorizing any single number and more about orienting yourself before a treatment plan arrives. If your dentist recommends something in the major or implant row, you now know two things going in. The price range is going to be meaningfully higher than anything you’ve budgeted for a cleaning, and your insurance, if you have it, is statistically less likely to cover the bulk of it. Neither of those is a reason to avoid necessary treatment. Both are reasons to ask for a written estimate and to check your specific benefits before you agree to a date.
Dental Costs by Life Stage
The barriers-to-care data above is broken out by age group for a reason: children, working-age adults and seniors face genuinely different cost and coverage realities, not just different clinical needs.
Children are, somewhat counterintuitively, the age group with the strongest coverage safety net. Medicaid’s Early and Periodic Screening, Diagnostic and Treatment (EPSDT) requirement obligates every state to provide comprehensive dental benefits to Medicaid-enrolled children. Pediatric dental coverage is also a required essential health benefit on ACA Marketplace plans. That’s a large part of why children showed the lowest rate of unmet dental need, 4.4%, of any age group in the ADA Health Policy Institute data cited earlier. The gap for kids tends to show up more in access, finding a pediatric dentist who accepts Medicaid in a given area, than in the coverage itself.
Working-age adults have the weakest safety net of any group, and the data backs that up starkly: 20% went without needed dental care, by far the highest rate of any age bracket. Adult dental coverage isn’t a required essential health benefit under the ACA, isn’t guaranteed under Medicaid in every state, and depends heavily on having an employer that offers it. An adult who loses employer coverage, through a job change, self-employment or a gap between jobs, can go from fully insured to fully exposed almost overnight. There’s no equivalent to keeping a child on Medicaid or a senior on Medicare Advantage in the interim.
Seniors sit in an unusual middle position. Original Medicare’s exclusion of routine dental care means turning 65 can actually mean losing dental coverage rather than gaining it. Only a Medicare Advantage plan with a dental supplement, or a standalone plan, fills that gap. Roughly a third of seniors get dental benefits this way. The remainder either pay cash, rely on a spouse’s plan, or go without, and unmet need for this group, 10.7% in the HPI data, lands between children’s and working-age adults’ rates. Dental Costs…
The Emergency Room Is Not a Substitute for a Dentist
One consequence of the coverage gap deserves its own section, because it’s both a real cost story and a cautionary one. Roughly 2 million emergency department visits a year in the U.S. involve a dental condition, according to a federal Healthcare Cost and Utilization Project analysis. The American Dental Association estimates the annual cost of those visits at around $1.6 to $2 billion.
The economics here are almost backwards from what you’d want. A dental-related ED visit averages roughly $749 when it doesn’t lead to hospitalization, according to ADA figures, compared with $90 to $200 for a typical dental office visit. That’s several times more for essentially the same acute problem. And the ADA notes that abscesses and dental caries, both largely preventable with regular care, account for nearly 80% of dental-related ED visits. More than two-thirds of these visits are billed to Medicaid or go unpaid as self-pay/uncompensated care, which tracks closely with who’s actually showing up. Adults aged 18 to 44, lower-income communities and non-Hispanic Black patients all use the ED for dental pain at meaningfully higher rates than the population overall.
None of this is a criticism of anyone who’s gone to an ER in dental pain. When a tooth is throbbing at 2 a.m. and no dentist is reachable, the ER is often the only option that feels available. The important thing to know going in is what an ER visit can and can’t actually do for a dental problem. Emergency room physicians aren’t dentists, don’t have dental equipment, and generally can only offer pain medication and sometimes an antibiotic, a bridge to an actual dental appointment, not a substitute for one. The underlying problem, the decayed tooth, the abscess, the fracture, is still there afterward and still needs a dentist to treat it. If cost is the reason you’re avoiding that follow-up dental visit, there are cheaper paths worth knowing about. A community health center, a dental school clinic or a payment plan, all covered later in this guide, is almost always a better financial outcome than a repeat ER visit.
Why Dental Costs Connect to Your Overall Health Costs
Treating dental costs as an isolated line item misses part of the picture. Untreated oral disease doesn’t stay contained to the mouth, and the data on this is specific enough to be worth knowing. The National Association of Dental Plans, citing broader research on the topic, notes that adults without dental benefits are 67% more likely to have heart disease than adults with dental coverage. That’s an association, not proof that one causes the other in every case. It is consistent, though, with a growing body of research connecting gum disease to cardiovascular risk, diabetes management and other chronic conditions.
The practical upshot for cost planning: skipping a $200 cleaning to save money this year isn’t purely a dental decision if it contributes to a larger, more expensive medical problem down the line. That’s not a reason to feel guilty about a skipped appointment; life and budgets are complicated. It is a reason to weigh preventive dental care against your broader health costs, not just against your dental plan’s annual maximum in isolation.
The Insurance Gap: Who Has Coverage and Who Doesn’t
Coverage is far from universal, and it’s less universal than medical insurance specifically. As of the most recent data from the National Association of Dental Plans, about 290 million Americans, 87% of the population, had some form of dental benefit at the end of 2024. That leaves roughly 40 million people with no dental coverage at all, a share several times higher than the uninsured rate for medical coverage.
| Coverage type | Rough share of the covered population | What it typically involves |
|---|---|---|
| Employer-sponsored group plan | The largest single source of coverage | Usually a dental PPO; dental PPOs make up about 89% of commercial dental enrollment |
| Individual or Marketplace plan | About 4.8% of the covered population | Purchased directly, sometimes bundled with a health plan; waiting periods are more common here |
| Medicaid or CHIP | Varies significantly by state | Comprehensive for children; adult benefits differ widely and are not guaranteed in every state |
| Medicare Advantage | About one-third of seniors | Supplemental dental benefit; not available under Original Medicare, which excludes routine dental care |
| Uninsured / cash-pay | About 13% of the population | No dental benefit at all; full fee paid directly, subject to any discount or financing arranged separately |
Two structural gaps are worth understanding on their own, because they explain a lot of what looks confusing about American dental coverage from the outside. First, Original Medicare simply doesn’t cover routine dental care. It never has. Seniors who want dental coverage after 65 generally need a Medicare Advantage plan with a dental supplement, a standalone dental plan, or the ability to pay cash. That’s a big part of why untreated dental problems climb sharply in this age group. Second, Medicaid dental coverage for adults is a state-by-state patchwork rather than a federal guarantee. A state can offer anything from emergency-only coverage to a fairly comprehensive adult dental benefit, and which one you get depends entirely on where you live, not on any national standard.
A third gap gets less attention but affects a growing share of workers: coverage during a transition. Someone leaving a job can typically extend an employer dental plan for a period through COBRA continuation, though usually at the full premium cost without an employer subsidy. That makes it expensive relative to what payroll deduction felt like. Self-employed workers and gig-economy workers have no employer plan to extend in the first place. They generally need to buy an individual dental plan directly, where waiting periods for major work are more common than on a typical employer group plan. Anyone planning a job change or a move to self-employment with known dental needs on the horizon has a real reason to think about that timing in advance. It’s better than discovering the gap after coverage has already lapsed.
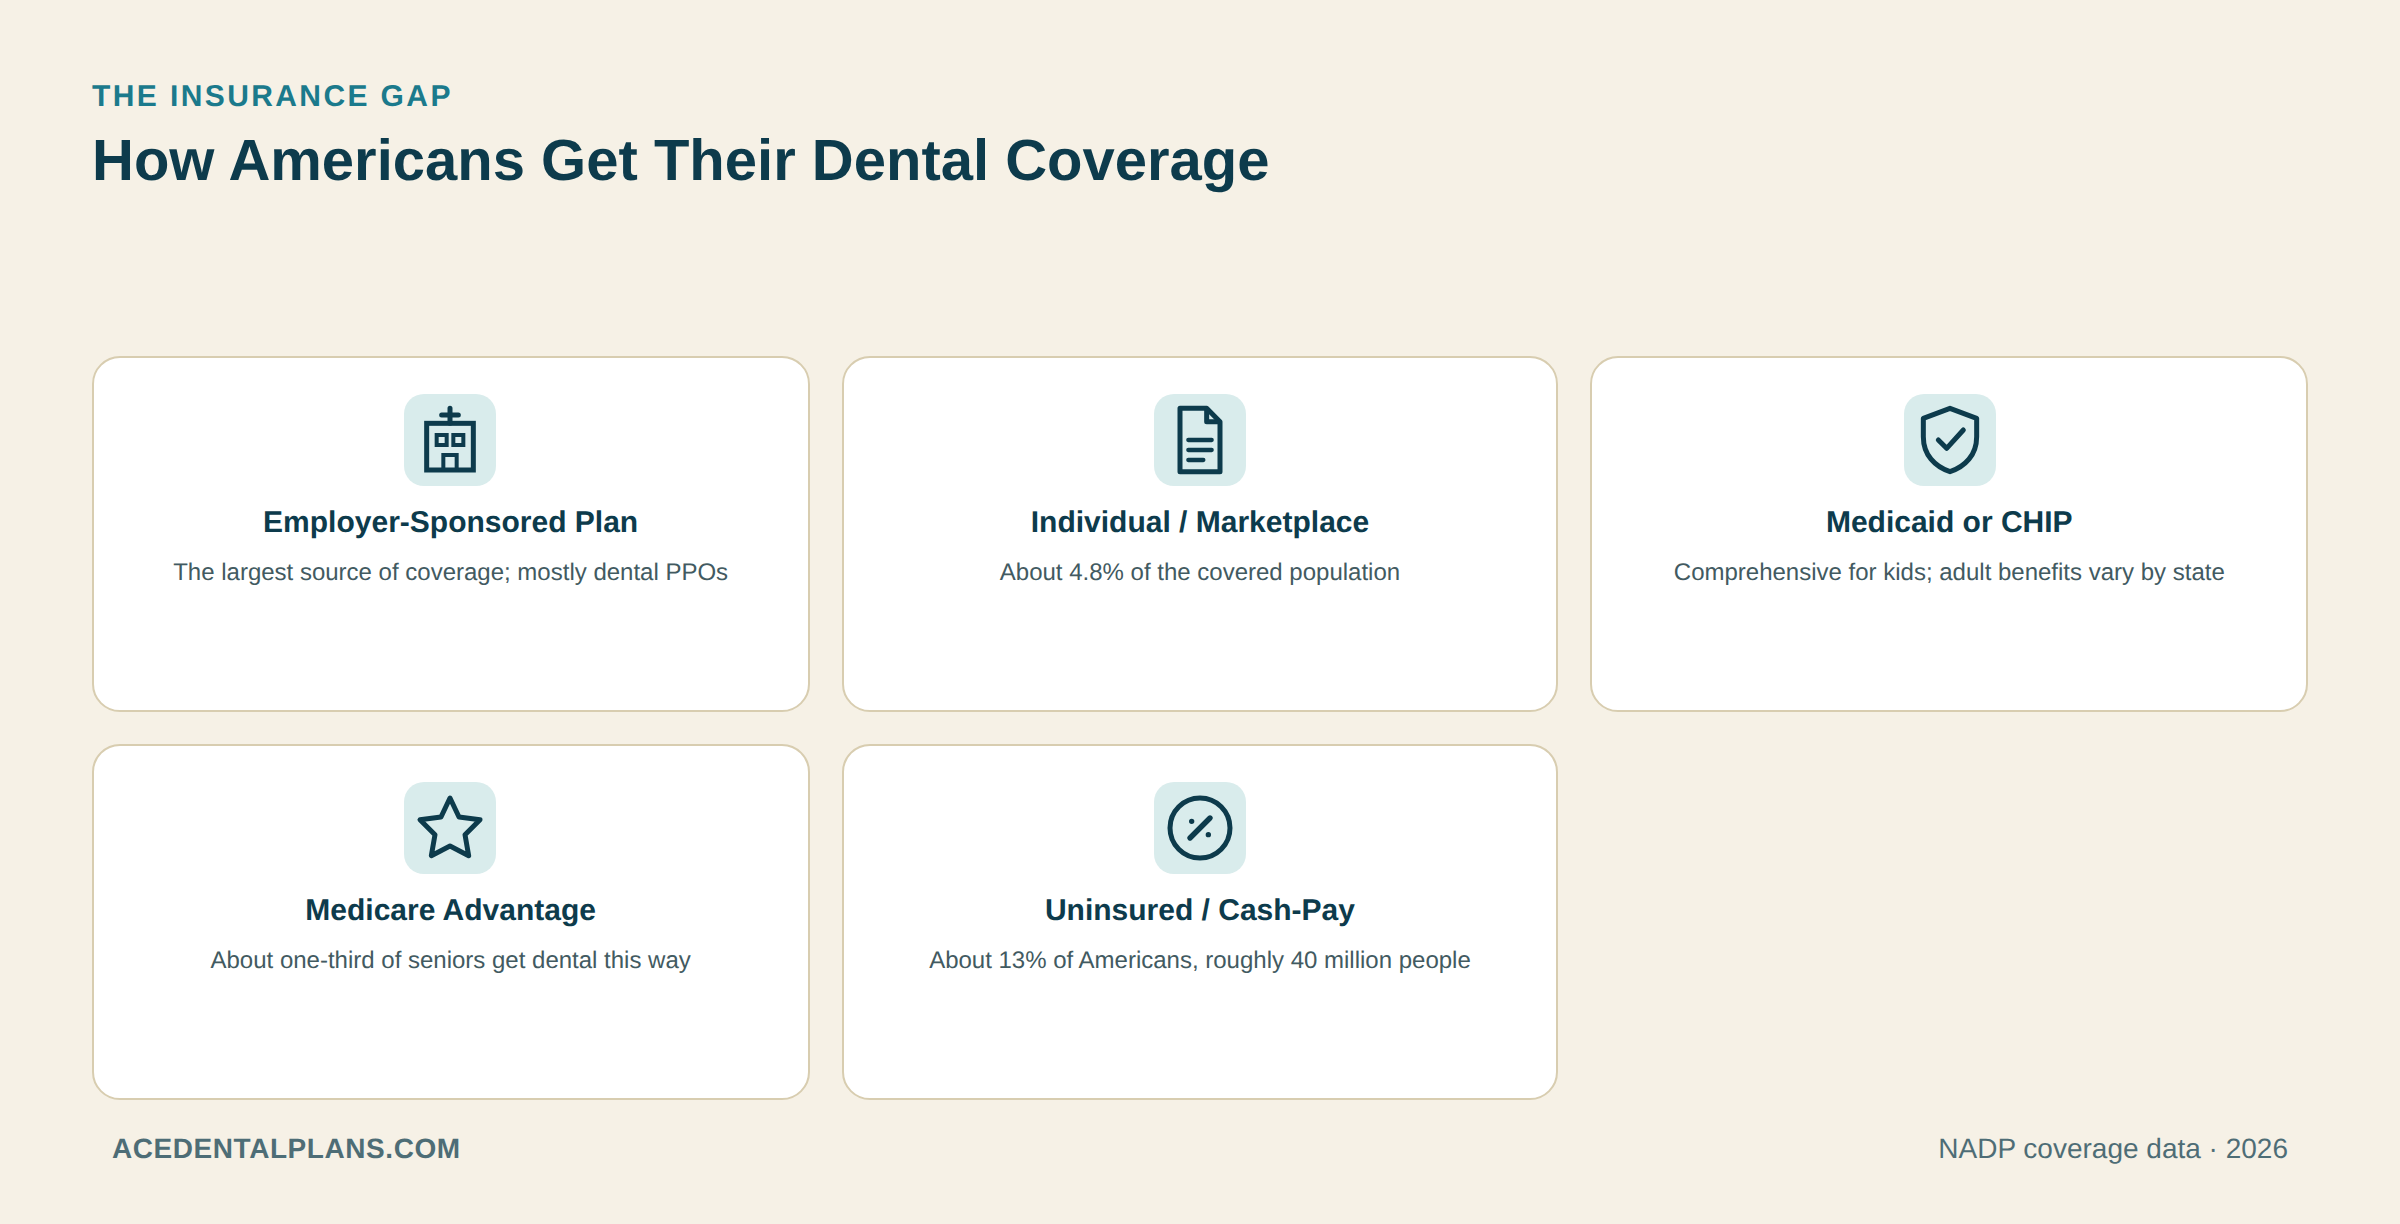 The patchwork of employer, individual, public and self-pay coverage that adds up to U.S. dental insurance.
What Happens When Cost Gets in the Way
The numbers above aren’t abstract. A widely cited ADA Health Policy Institute analysis found that about 15.2% of the U.S. population, roughly 47.6 million people, needed dental care over a multi-year study period but didn’t get it. Working-age adults were hit hardest, at 20%, compared with 4.4% of children and 10.7% of seniors. That gap tracks closely with which age groups are least likely to have any dental coverage at all.
When people in that study explained why, the top three reasons were all financial. They couldn’t afford the cost, insurance didn’t cover the procedure, or they didn’t want to spend the money even when they technically could. Fear, distance and inconvenience, the reasons you might expect to dominate, were consistently smaller factors. Affordability, not access in the geographic sense, is the real barrier for most people who go without care they know they need.
That barrier isn’t distributed evenly. Among working-age adults below 133% of the federal poverty level, 33% cited a financial barrier to dental care, nearly three times the 12.4% rate among higher-income working-age adults. The pattern repeats among seniors, where low-income adults reported financial barriers at roughly double the rate of their higher-income peers. Out-of-pocket dental spending averaged about $310 per adult per year in the underlying data, but rose to $523 for adults below the poverty line. The people with the least room in their budget are also the ones paying the most, relative to their income.
The downstream effect shows up in oral health outcomes, not just in spending. According to the CDC, uninsured adults have untreated cavities at roughly double the rate of adults with private dental insurance, 43% versus 18%. That’s not a small gap. It’s clear evidence that coverage, not just willpower or education about oral hygiene, meaningfully changes whether a cavity gets treated while it’s small and cheap, or waits until it’s large and expensive.
 How income and insurance status change the odds of getting needed dental care.
Paying Without Insurance: What Cash-Pay Actually Looks Like
If you’re one of the roughly 40 million Americans without dental coverage, or your plan simply doesn’t cover what you need, paying cash isn’t automatically a disaster. It rarely feels that way in the moment, but the numbers are often more manageable than they first appear. It does mean the practice’s full fee applies, without a negotiated network discount sitting between you and the bill.
A few things change the arithmetic in your favor, though. Many practices offer a modest prompt-payment or cash discount, since they avoid the administrative cost and delay of billing an insurer. In-house membership plans, an annual or monthly fee covering preventive visits plus a discount on other treatment, have become common at practices that don’t accept insurance at all. They can function similarly to a dental plan’s preventive benefit, without any waiting period or claims process. And because there’s no annual maximum to worry about hitting, a cash-pay patient facing a large treatment plan sometimes has more flexibility to phase treatment across a few months. That timing can revolve purely around their own budget, rather than around a plan year’s reset date.
This membership model is worth a closer look, since it’s become common enough to be a real alternative rather than a niche option. A typical practice membership runs somewhere in the range of $200 to $600 a year per person, covering two cleanings, exams and routine X-rays outright. On top of that, it usually adds a flat discount, often 10% to 20%, on any other treatment performed at that same practice. Compared with a traditional dental insurance premium, a membership plan usually costs less per year. But it offers no coverage toward major work beyond the flat discount, no annual maximum being paid down by an insurer, and no coverage if you need treatment at a different practice. It tends to make the most sense for someone who’s healthy, visits the dentist mainly for routine care, and wants predictable preventive costs without the underwriting and paperwork of traditional insurance.
How to Read a Dental Estimate or Bill
Whether you’re insured or paying cash, a dental estimate or bill uses a specific vocabulary that’s worth understanding on its own, separate from any single procedure’s price.
- Billed amount is what the practice charges for a procedure before any insurance adjustment. If you’re uninsured, this is generally the number that applies to you, before any cash discount the practice offers.
- Allowed amount is what your insurer recognizes as the covered charge for a procedure code, which can be lower than the billed amount, especially with an in-network dentist. Your coinsurance percentage applies to this number, not necessarily to the full billed amount.
- Deductible is what you pay out of pocket each plan year before your insurance starts sharing costs on covered categories, typically waived for preventive care.
- Coinsurance is your share of the allowed amount after the deductible, commonly expressed as a percentage that varies by category of care.
- Annual maximum is the most your dental plan will pay in a plan year, across every procedure combined, not per procedure.
- Your responsibility is the final line that actually matters: what’s left after the allowed amount, coinsurance, deductible and annual maximum have all been applied.
A written, itemized estimate should show each of these figures line by line, for each proposed procedure, before you agree to treatment. If an estimate only shows a single total, it’s reasonable to ask the office to break it down by procedure code. That way you can see exactly which figure changed if the final bill ends up different from the estimate.
The honest trade-off: without insurance sharing the cost of major or unexpected work, a cash-pay patient carries more risk if a bigger problem turns up. That’s the real argument for dental coverage even at a modest premium, not that it makes routine care free, but that it caps your exposure if something expensive comes up unexpectedly.
Lowering the Bill: Realistic Ways to Manage Dental Costs
Whether you have insurance or not, a handful of tools can meaningfully change what you actually pay. None of them work for every situation, so it’s worth understanding what each one actually does before assuming it’s the right fix.
| Option | What it actually does | Works well for | Trade-off to weigh |
|---|---|---|---|
| Discount dental plan | Membership fee in exchange for pre-negotiated reduced fees at participating dentists | Uninsured patients who want lower fees without insurance underwriting or waiting periods | Not insurance; savings vary by plan and procedure |
| FSA or HSA | Pre-tax dollars set aside for eligible dental expenses | Anyone with access through an employer or a high-deductible health plan | FSA funds are often use-it-or-lose-it within the plan year |
| Dental school clinic | Supervised student care at a meaningfully reduced fee | Non-urgent treatment where a longer appointment is an acceptable trade | Appointments take longer due to the teaching component |
| Community health center | Sliding-scale fees based on income | Lower-income patients near a participating center | Availability and services vary by location |
| Payment plan or financing | Spreads a large bill into installments, in-house or third-party | Necessary treatment that can’t reasonably be delayed or phased | Read deferred-interest terms carefully before signing |
A less obvious lever: timing. Since a dental plan’s annual maximum resets each plan year, splitting a large, non-urgent treatment plan across two plan years can sometimes make better use of two separate maximums instead of one. That’s a reasonable question to raise with your dentist’s office when a treatment plan isn’t urgent, though it needs to be weighed against how much waiting actually costs you clinically, not just financially.
Shopping around is also more useful than it might sound for anything beyond routine cleanings. Ask more than one practice for a full, itemized estimate for the same proposed treatment, not just a single total number. That way you’re comparing the same components, rather than two different scopes of work with similar-looking price tags.
One more tool is easy to overlook because it isn’t dental-specific: the medical and dental expense deduction on a federal tax return. If you itemize deductions and your total unreimbursed medical and dental expenses for the year exceed 7.5% of your adjusted gross income, the amount above that threshold may be deductible. This isn’t relevant for most people in most years, since it requires itemizing and a fairly high expense total relative to income. But for a year that includes a major procedure like an implant or a full set of dentures, it’s worth mentioning to a tax preparer rather than assuming it doesn’t apply. A tax professional, not this guide, is the right source for whether it applies to your specific return.
 Five practical levers for bringing a dental bill down, whether or not you have insurance.
Questions Worth Asking Before You Commit to Treatment
A treatment plan is a proposal, not an obligation, and a short list of direct questions can save real money before you agree to anything.
- What’s included in this estimate, and what isn’t? Imaging, anesthesia, follow-up visits and lab fees are sometimes bundled into a quote and sometimes billed separately later.
- Is this treatment urgent, or could it reasonably wait? Not every recommendation carries the same clinical timeline, and knowing which is which changes how much room you have to plan financially.
- What would a less expensive alternative look like, and what would I be trading off? There’s rarely a single right answer here; it depends on your specific case, your budget and how you weigh long-term value against upfront cost.
- Are you in network with my plan, and is that different from being in network for this specific procedure? A general dentist’s network status doesn’t automatically apply to a specialist they refer you to.
- Can I get a written, itemized estimate I can compare against a second opinion? This is standard practice for anything beyond routine care, not a sign of distrust in your current dentist.
None of these questions require a background in dentistry or insurance to ask. A practice that regularly works with patients paying different ways, insured, uninsured, financed, will be used to answering all five.

Frequently Asked Questions – Dental Costs
Why do dental costs vary so much by location?
Rent, staff wages and general cost of living differ significantly by state and metro area, and a dental practice’s overhead flows directly into its fee schedule. The same procedure can reasonably cost hundreds of dollars more in a high-cost market than in a lower-cost one, with no difference in the clinical work performed.
Is dental insurance worth it if I rarely need major work?
This depends on your premium relative to what you’d spend in cash for the preventive visits you actually use, since preventive care is usually what plans cover most generously. If you expect major work during the plan year, insurance is more likely to offset a meaningful share of that larger cost, subject to your deductible, coinsurance and annual maximum.
Why is dental insurance separate from health insurance in the U.S.?
Historically, dental and medical care developed as separate professions and separate insurance markets in the U.S., and most medical plans still exclude routine dental care. Pediatric dental coverage is a required essential health benefit on ACA Marketplace plans, but adult dental coverage generally isn’t, which is why most adults need a distinct dental plan or pay cash for dental care.
What’s the biggest reason people skip dental care they need?
Affordability. In ADA Health Policy Institute research, the top reasons people gave for skipping needed dental care were all cost-related: couldn’t afford it, insurance didn’t cover it, or didn’t want to spend the money, well ahead of fear, distance or inconvenience.
Does Medicaid cover dental care for adults?
It depends entirely on your state. Medicaid dental coverage for children is comprehensive nationwide under federal requirements, but adult dental benefits vary widely by state, from emergency-only coverage to a fairly complete benefit. Check your specific state Medicaid program directly for current adult dental coverage.
Why doesn’t Medicare cover routine dental care?
Original Medicare has excluded routine dental services since it was created, with only a narrow, recently clarified exception for dental care tied directly to certain other covered medical procedures. Many seniors get dental coverage instead through a Medicare Advantage plan with a dental supplement or through a separate standalone dental plan.
Are cash-pay prices always higher than insurance prices?
Not necessarily. An in-network insurance rate is typically lower than a practice’s full fee, but many practices also offer a cash or prompt-payment discount. Some discount dental plans and in-house membership programs can even bring a cash price close to, or sometimes below, what an insured patient effectively pays after their own coinsurance and deductible.
How much should I budget for dental care in a typical year?
National data puts average out-of-pocket dental spending around $310 per adult per year. That figure varies enormously, though, based on whether you need only preventive care or also require basic or major restorative work in a given year. Treat any national average as a planning reference, not a prediction of your own bill.
Why is emergency dental care so much more expensive than a regular visit?
An emergency room visit for a dental problem averages around $749 when it doesn’t lead to hospitalization, compared with $90 to $200 for a typical dental office visit. The gap is largely because an ER can only manage pain and infection rather than treat the underlying dental problem, and hospital-based emergency care carries much higher overhead than a dental practice. Same-day or after-hours dental appointments also typically cost more than a routine scheduled visit, though far less than an ER.
Can I deduct dental expenses on my taxes?
Possibly, if you itemize deductions and your total unreimbursed medical and dental expenses for the year exceed 7.5% of your adjusted gross income. This threshold means it typically only applies in a year with unusually high dental or medical costs, such as major restorative or implant work. Confirm your specific situation with a tax professional rather than relying on a general guide.
Do self-employed people have fewer dental insurance options?
Not fewer exactly, but different. Without an employer group plan, a self-employed worker typically buys an individual or family dental plan directly, sometimes through a Marketplace-adjacent product. Waiting periods for major services tend to be more common on these plans than on a typical employer plan. Some self-employed people instead rely on a discount dental plan or pay cash, weighing the lower ongoing cost against having less protection if a large expense comes up.
Why do children seem to have better dental coverage than working-age adults?
Federal rules require comprehensive dental coverage for Medicaid-enrolled children and make pediatric dental a required essential health benefit on ACA Marketplace plans. Neither requirement extends to adults. Adult dental coverage depends on having an employer that offers it, buying an individual plan, or in some states, qualifying for a Medicaid adult dental benefit. That’s why working-age adults have the least consistent coverage of any age group.
What’s the difference between the billed amount and the allowed amount on a dental bill?
The billed amount is what the practice charges before any insurance adjustment. The allowed amount is what your insurer recognizes as the covered charge for that procedure code, which is often lower than the billed amount, particularly with an in-network dentist. Your coinsurance percentage is calculated against the allowed amount, which is why understanding this distinction matters more than the coinsurance percentage alone.
Is a dental membership plan the same as dental insurance?
No. A membership plan is an agreement directly with one dental practice, typically covering preventive visits at that practice plus a flat discount on other treatment. There’s no claims process, and no coverage at a different office. Dental insurance is a broader benefit, usually with a network of dentists, coinsurance on multiple categories of care and an annual maximum. Each fits a different situation, and neither is strictly better in every case.
What’s the cheapest way to get necessary dental work done without insurance?
For non-urgent treatment, a dental school clinic or a community health center’s sliding-scale fee usually offers the lowest realistic price. Both are structured specifically to reduce cost, rather than to operate as a standard for-profit practice. A discount dental plan or a practice’s own cash discount can also meaningfully lower a bill. Whichever option you use, get a full itemized estimate first, since “cheapest” only means something once you know exactly what’s included.
Why did my dental estimate change between my first visit and my actual bill?
This usually means the treatment performed differed from what was originally planned, which is common once a dentist can see a problem directly rather than estimating from an exam or an X-ray alone. It can also reflect a change in your insurance eligibility or remaining annual maximum between the estimate and the completed treatment. Either way, ask your dentist’s office to walk through what changed, procedure by procedure, rather than comparing only the two total numbers.
Dental costs in the U.S. add up to a specific, somewhat unusual shape. It’s a large national market still built around direct patient payment, with coverage that reaches most but not all Americans unevenly, and a cost curve that rises sharply right where insurance coverage tends to thin out. None of that changes what you’ll pay for your own next appointment. Knowing the shape of the system, though, makes it easier to see where you actually have leverage. Shop around for major work, understand which category of care you’re in, use the coverage or financing tools that fit your situation, and ask direct questions before you commit to a treatment plan.
Sources and Disclaimers – Dental Costs
National dental spending figures and payer-mix data in this guide come from the Centers for Medicare & Medicaid Services’ National Health Expenditure data and from the American Dental Association’s Health Policy Institute. Figures on dental coverage rates, coverage types and their approximate shares of the covered population come from the National Association of Dental Plans, as does the statistic on heart disease risk among adults without dental benefits. Statistics on unmet dental care needs, reasons for skipping care and income-based disparities in financial barriers come from ADA Health Policy Institute research. Figures on untreated cavity rates by insurance status and broader oral health disparities come from the CDC. Emergency department visit volume and payer-mix statistics come from a federal Healthcare Cost and Utilization Project (HCUP) statistical brief. ED visit cost comparisons and the share of visits tied to preventable conditions come from the American Dental Association’s Action for Dental Health program. The price-band table (Table 1) aggregates procedure-level cost ranges into broader categories, using the same underlying sourcing used elsewhere on this site. That includes a 2023–2024 nationwide dental procedure-cost survey conducted for CareCredit, a 2024 Synchrony dental cost study cited by Guardian, and metro-market pricing examples from Humana’s dental pricing tool. The household cash-pay example and Table 3’s ways-to-lower-costs guidance are original illustrative content built for this guide, not figures from any single source. Figures in this guide are national averages and ranges; your own costs and coverage depend on your location, your specific plan and your dentist’s individual fees. Confirm current pricing directly with your dentist and current benefits with your insurer, and consult a tax professional regarding the medical expense deduction.
- Centers for Medicare & Medicaid Services — National Health Expenditures 2024 Highlights
- American Dental Association Health Policy Institute — National Dental Expenditures
- American Dental Association Health Policy Institute — Main Barriers to Getting Needed Dental Care Relate to Costs
- Centers for Disease Control and Prevention — Health Disparities in Oral Health
- National Association of Dental Plans — Understanding Dental Benefits
- Healthcare Cost and Utilization Project (HCUP), Agency for Healthcare Research and Quality — Emergency Department Visits Involving Dental Conditions, 2018
- American Dental Association — Emergency Department Referrals
Important Information and Disclaimers
This article is general educational information. By using it, you accept the limits described below.
Not dental or medical advice
Nothing on this page is a diagnosis, a treatment recommendation or a substitute for an examination by a licensed dentist or physician. Reading this article does not create a dentist-patient or doctor-patient relationship. Only a licensed professional who has examined you and reviewed your history can tell you what your mouth needs. Do not delay, skip or stop professional care because of something you read here.
Prices are estimates, not quotes
Cost figures are ranges reported by the third-party sources cited in this article. Actual prices depend on your location, the provider, the complexity of your case, the materials used, the date of service and other factors, so what you pay may be higher or lower. A written treatment plan and fee estimate from the dental office is the only reliable number for your situation.
Insurance and plan examples are illustrations
Examples that use named amounts or percentages are hypothetical. Real benefits depend on your plan, network, waiting periods, annual maximum, deductible and the insurer’s rules at the time of treatment. A pre-treatment estimate or benefits check is not a promise of payment. Confirm the details with your insurer or plan administrator in writing.
Not insurance, legal, tax or financial advice
AceDentalPlans is an information publisher. Nothing here is insurance, legal, tax, investment or other professional financial advice, and nothing here recommends a particular provider, insurer, lender, discount plan or financing product. Company and product names belong to their owners and appear for identification only. Read the terms of any loan, financing offer or plan before you sign, and ask a qualified professional if you need advice on your own circumstances.
Third-party sources
This article cites government agencies, professional associations, insurers, lenders and other outside organizations. We do not control those sources. Their content can change, move or disappear, and listing a source is not an endorsement of it or of anything it sells.
No warranty
We aim for accuracy, but this article is provided “as is,” without warranties of any kind, express or implied, including warranties of accuracy, completeness, timeliness or fitness for a particular purpose. Some information may be out of date or contain errors by the time you read it.
Limitation of responsibility
To the fullest extent permitted by law, AceDentalPlans and its owners, authors and contributors are not responsible or liable for any loss, cost, injury, health outcome or other damage that results from using this article or relying on it. You are responsible for your own decisions about your care, your coverage and your money.
How this article is written
This article follows AceDentalPlans’ answer-first, U.S.-focused editorial approach. It uses conditional language for insurance, because coverage depends on the specific plan, and it names its sources so that you can read them yourself.
† National dental spending and average out-of-pocket figures are drawn from CMS National Health Expenditure data and ADA Health Policy Institute research, cited in full in the sources section below.